Use patterns in CloudWatch Logs Insights to investigate production issues faster
- Authors

- Name
- Tomasz Łakomy
- @tlakomy
Browsing through CloudWatch Logs can be a chore, especially when you're debugging a production issue. Having to sift through thousands (if not more!) log lines can be a daunting task, especially when you're not sure what you're looking for.
Let's take an example - suppose we're working on a serverless app that uses DynamoDB as a database. We're seeing some errors in our Lambda functions and we want to see if there's anything in the logs that could help us debug the issue.
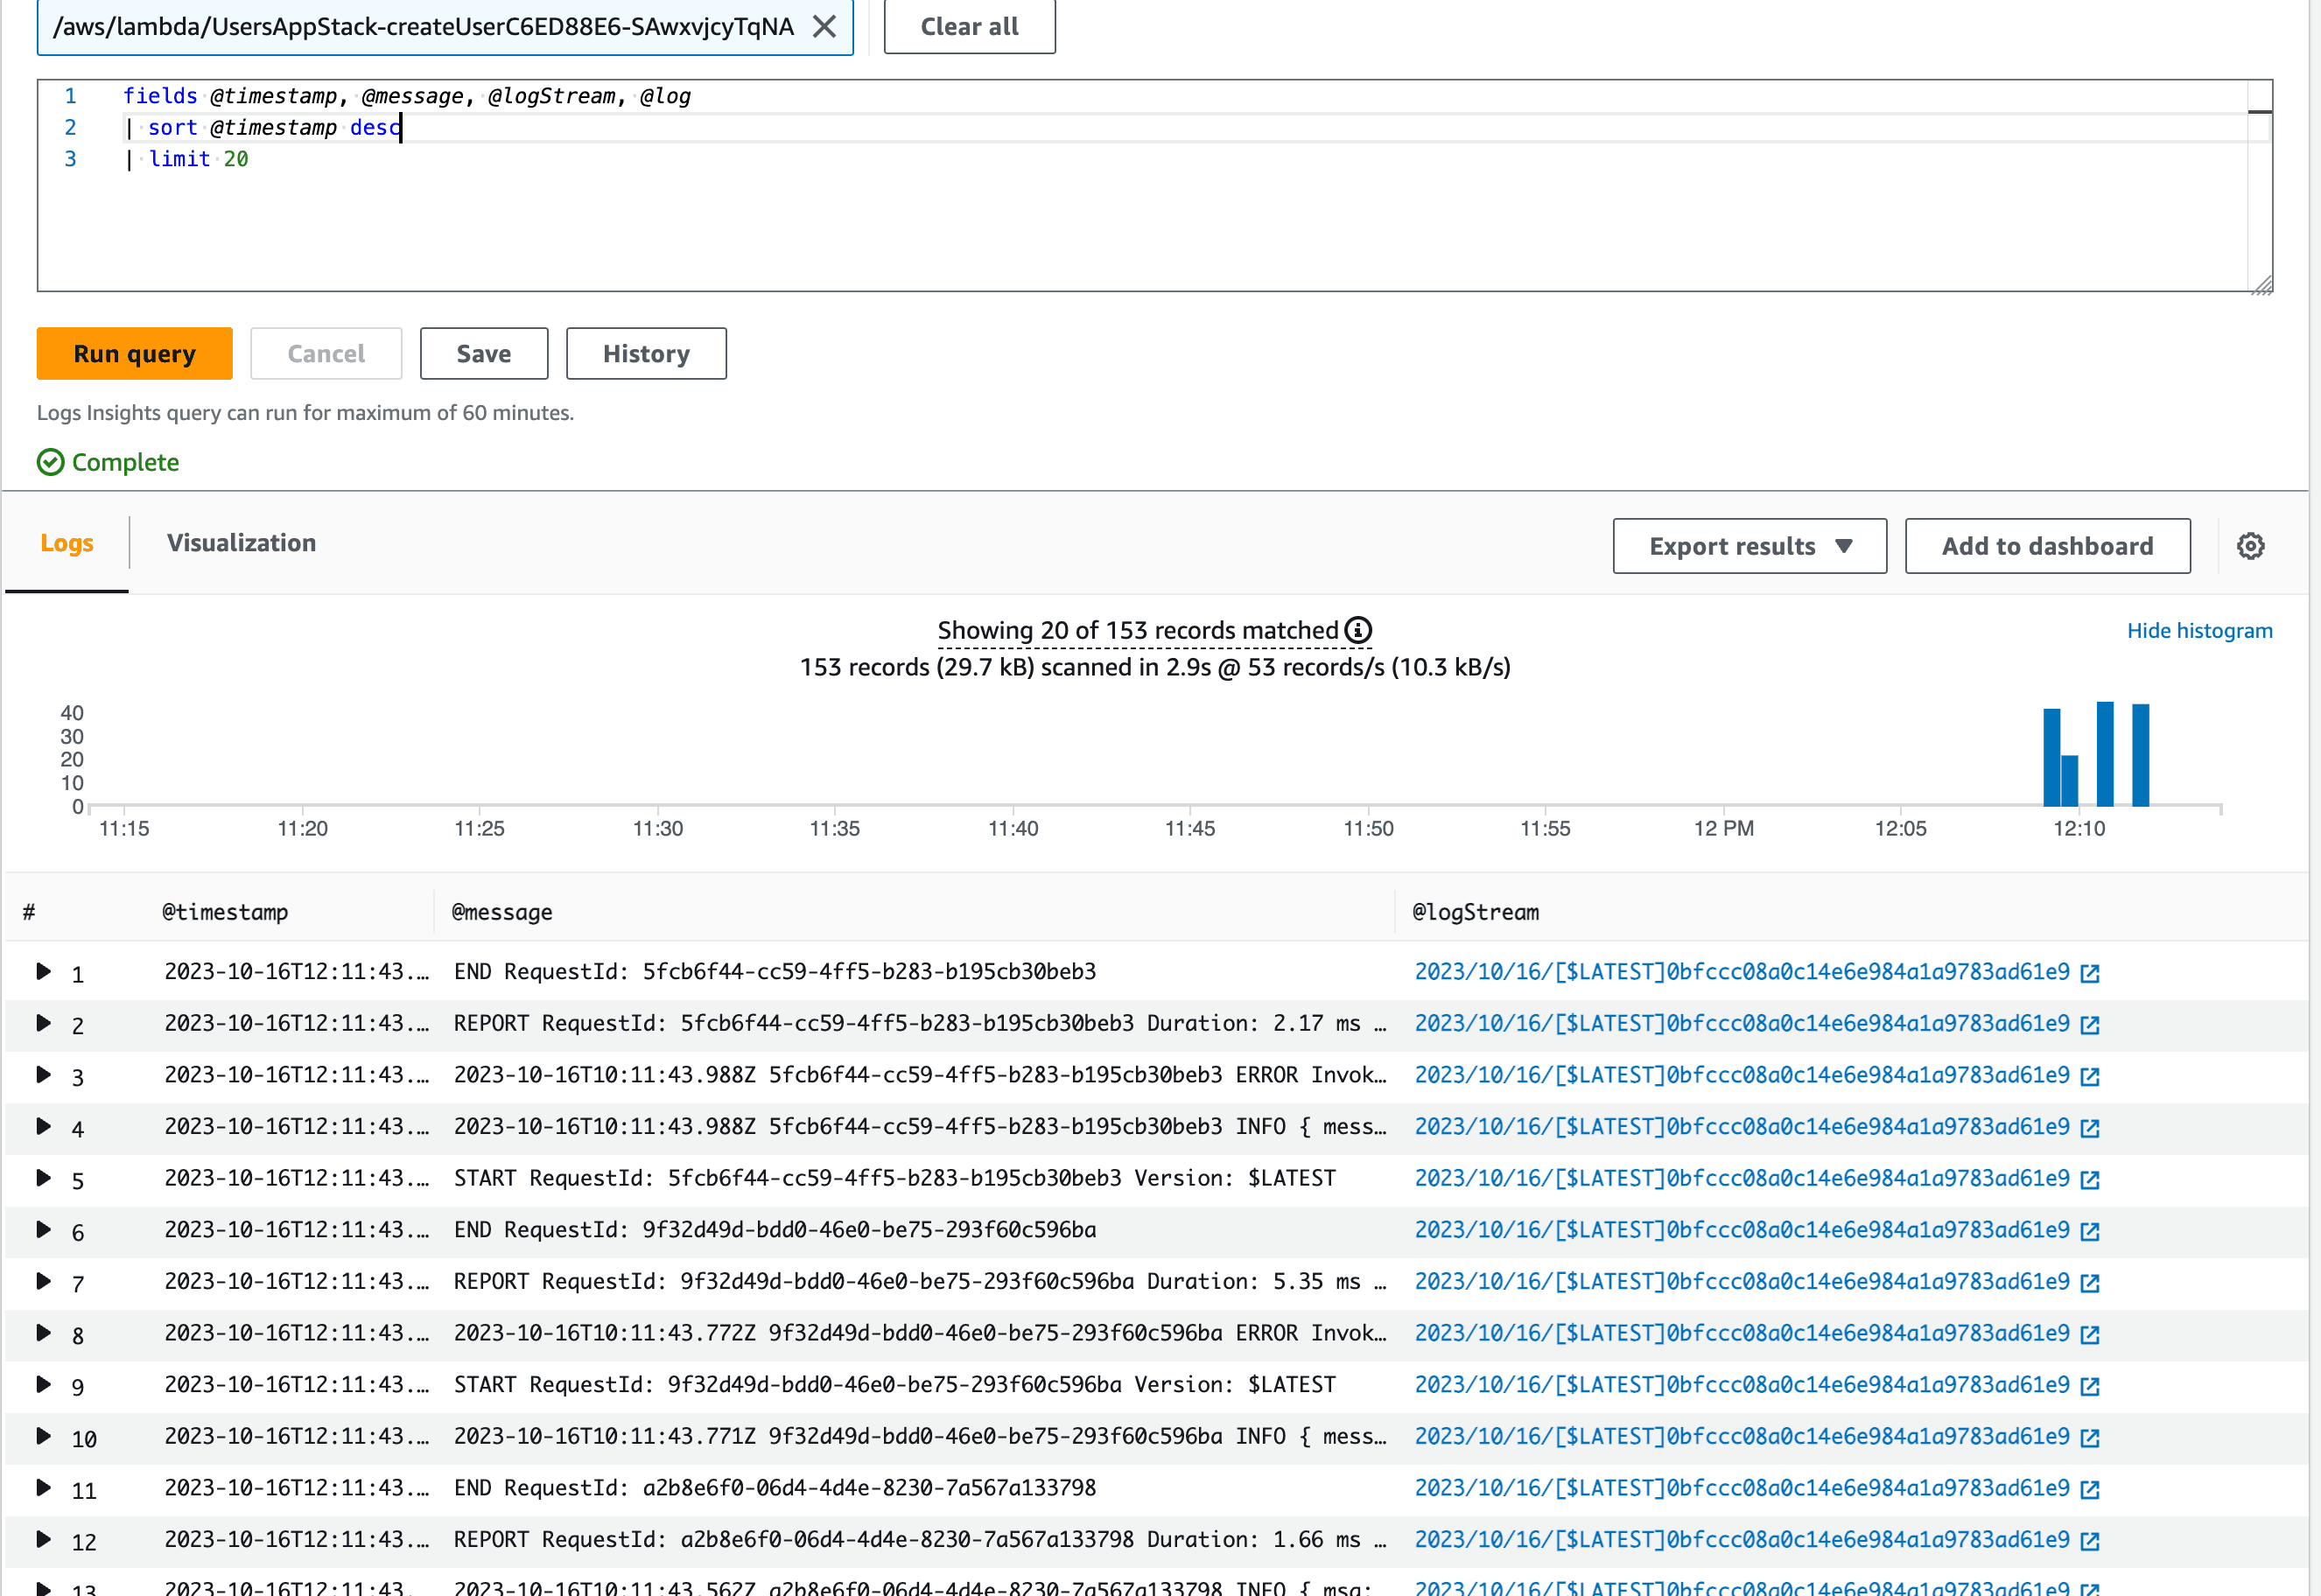
Customers reported issues with the logic handled by createUser function so let's see what's going on by running a basic Logs Insights query:
fields @timestamp, @message, @logStream, @log
| sort @timestamp desc
| limit 20

As you can see - by default we're getting all the logs, including START, REPORT and END entries. While they can be useful in some cases, they're not really helpful in our case. Let's narrow down the search by looking only for errors.
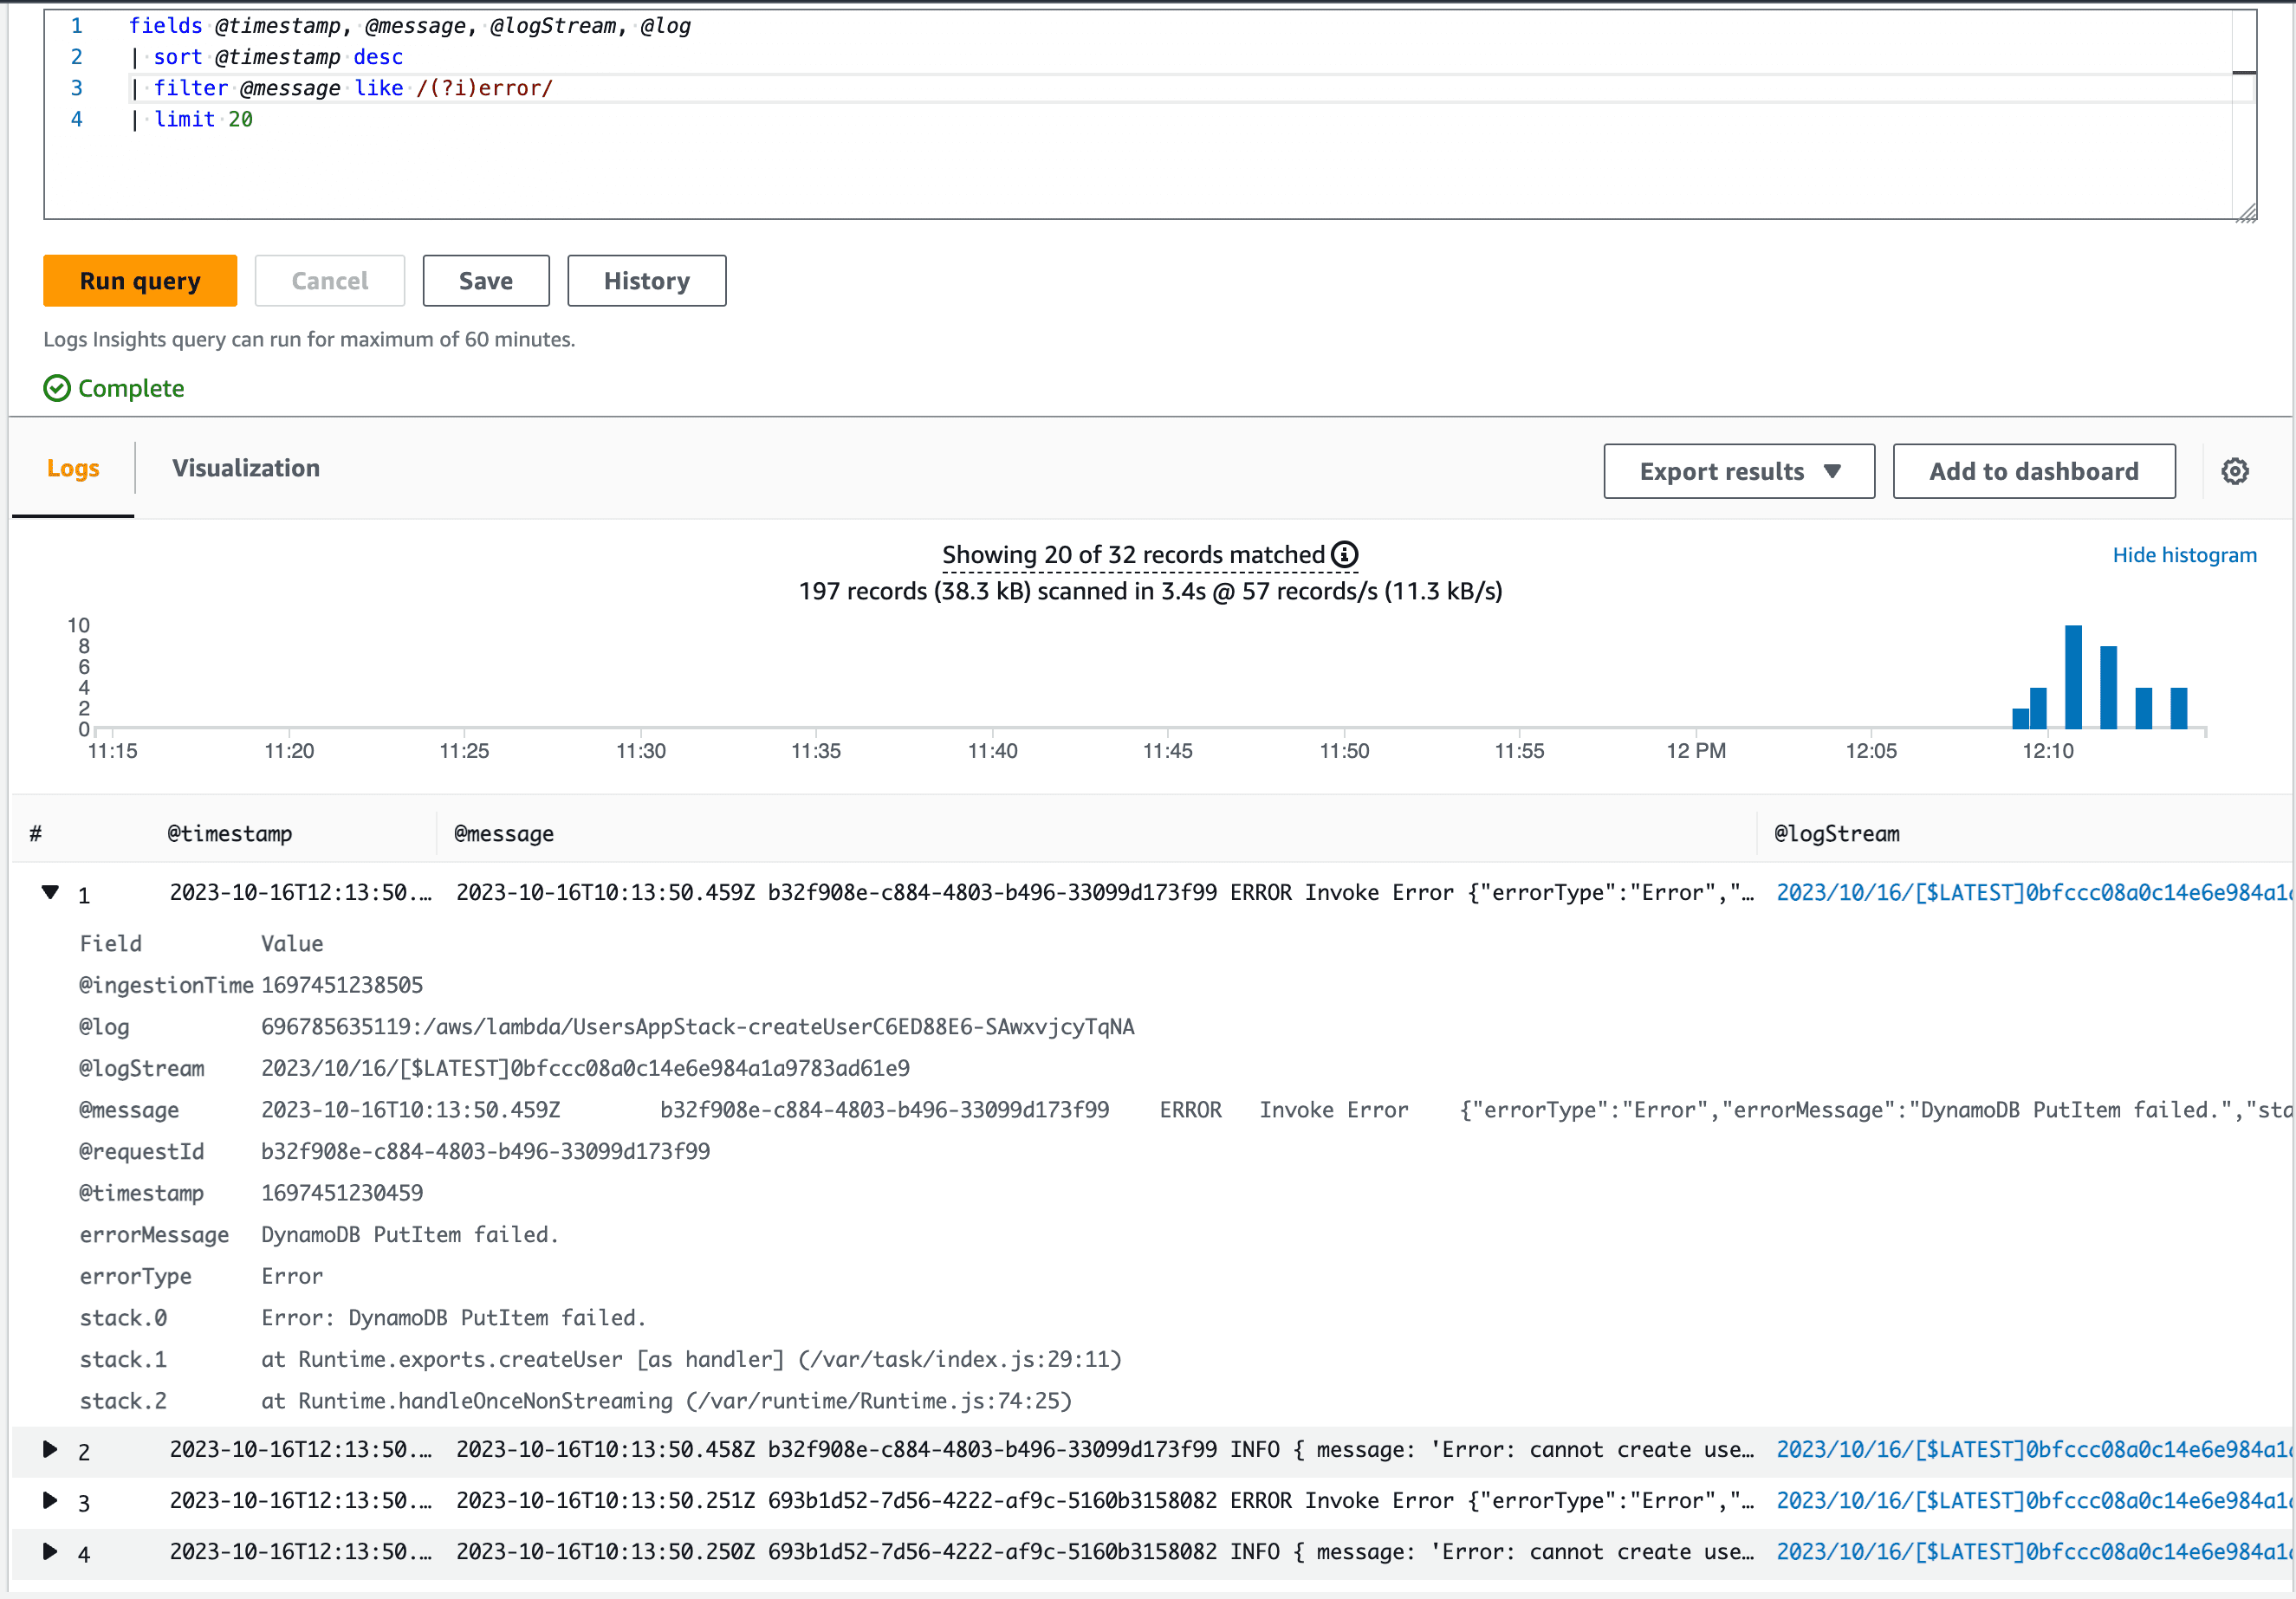
fields @timestamp, @message, @logStream, @log
| sort @timestamp desc
| filter @message like /(?i)error/
| limit 20
If you're confused about that /(?i)error/ syntax, you may want to check out Match case-insensitive patterns when using CloudWatch Logs Insights article.

Okay, this is slightly better - we're getting only the logs that contain the word error in them. Since we applied a limit command, we're only getting latest 20 entries, which is a lot to go through (especially at 2am).
When investigating a production issue our goal is to get to the root cause as quickly as possible. We don't want to spend time looking through the logs, we want to find the issue and fix it.
Here's how the new addition to CloudWatch Logs Insights - pattern keyword - can help.
Let's update our query:
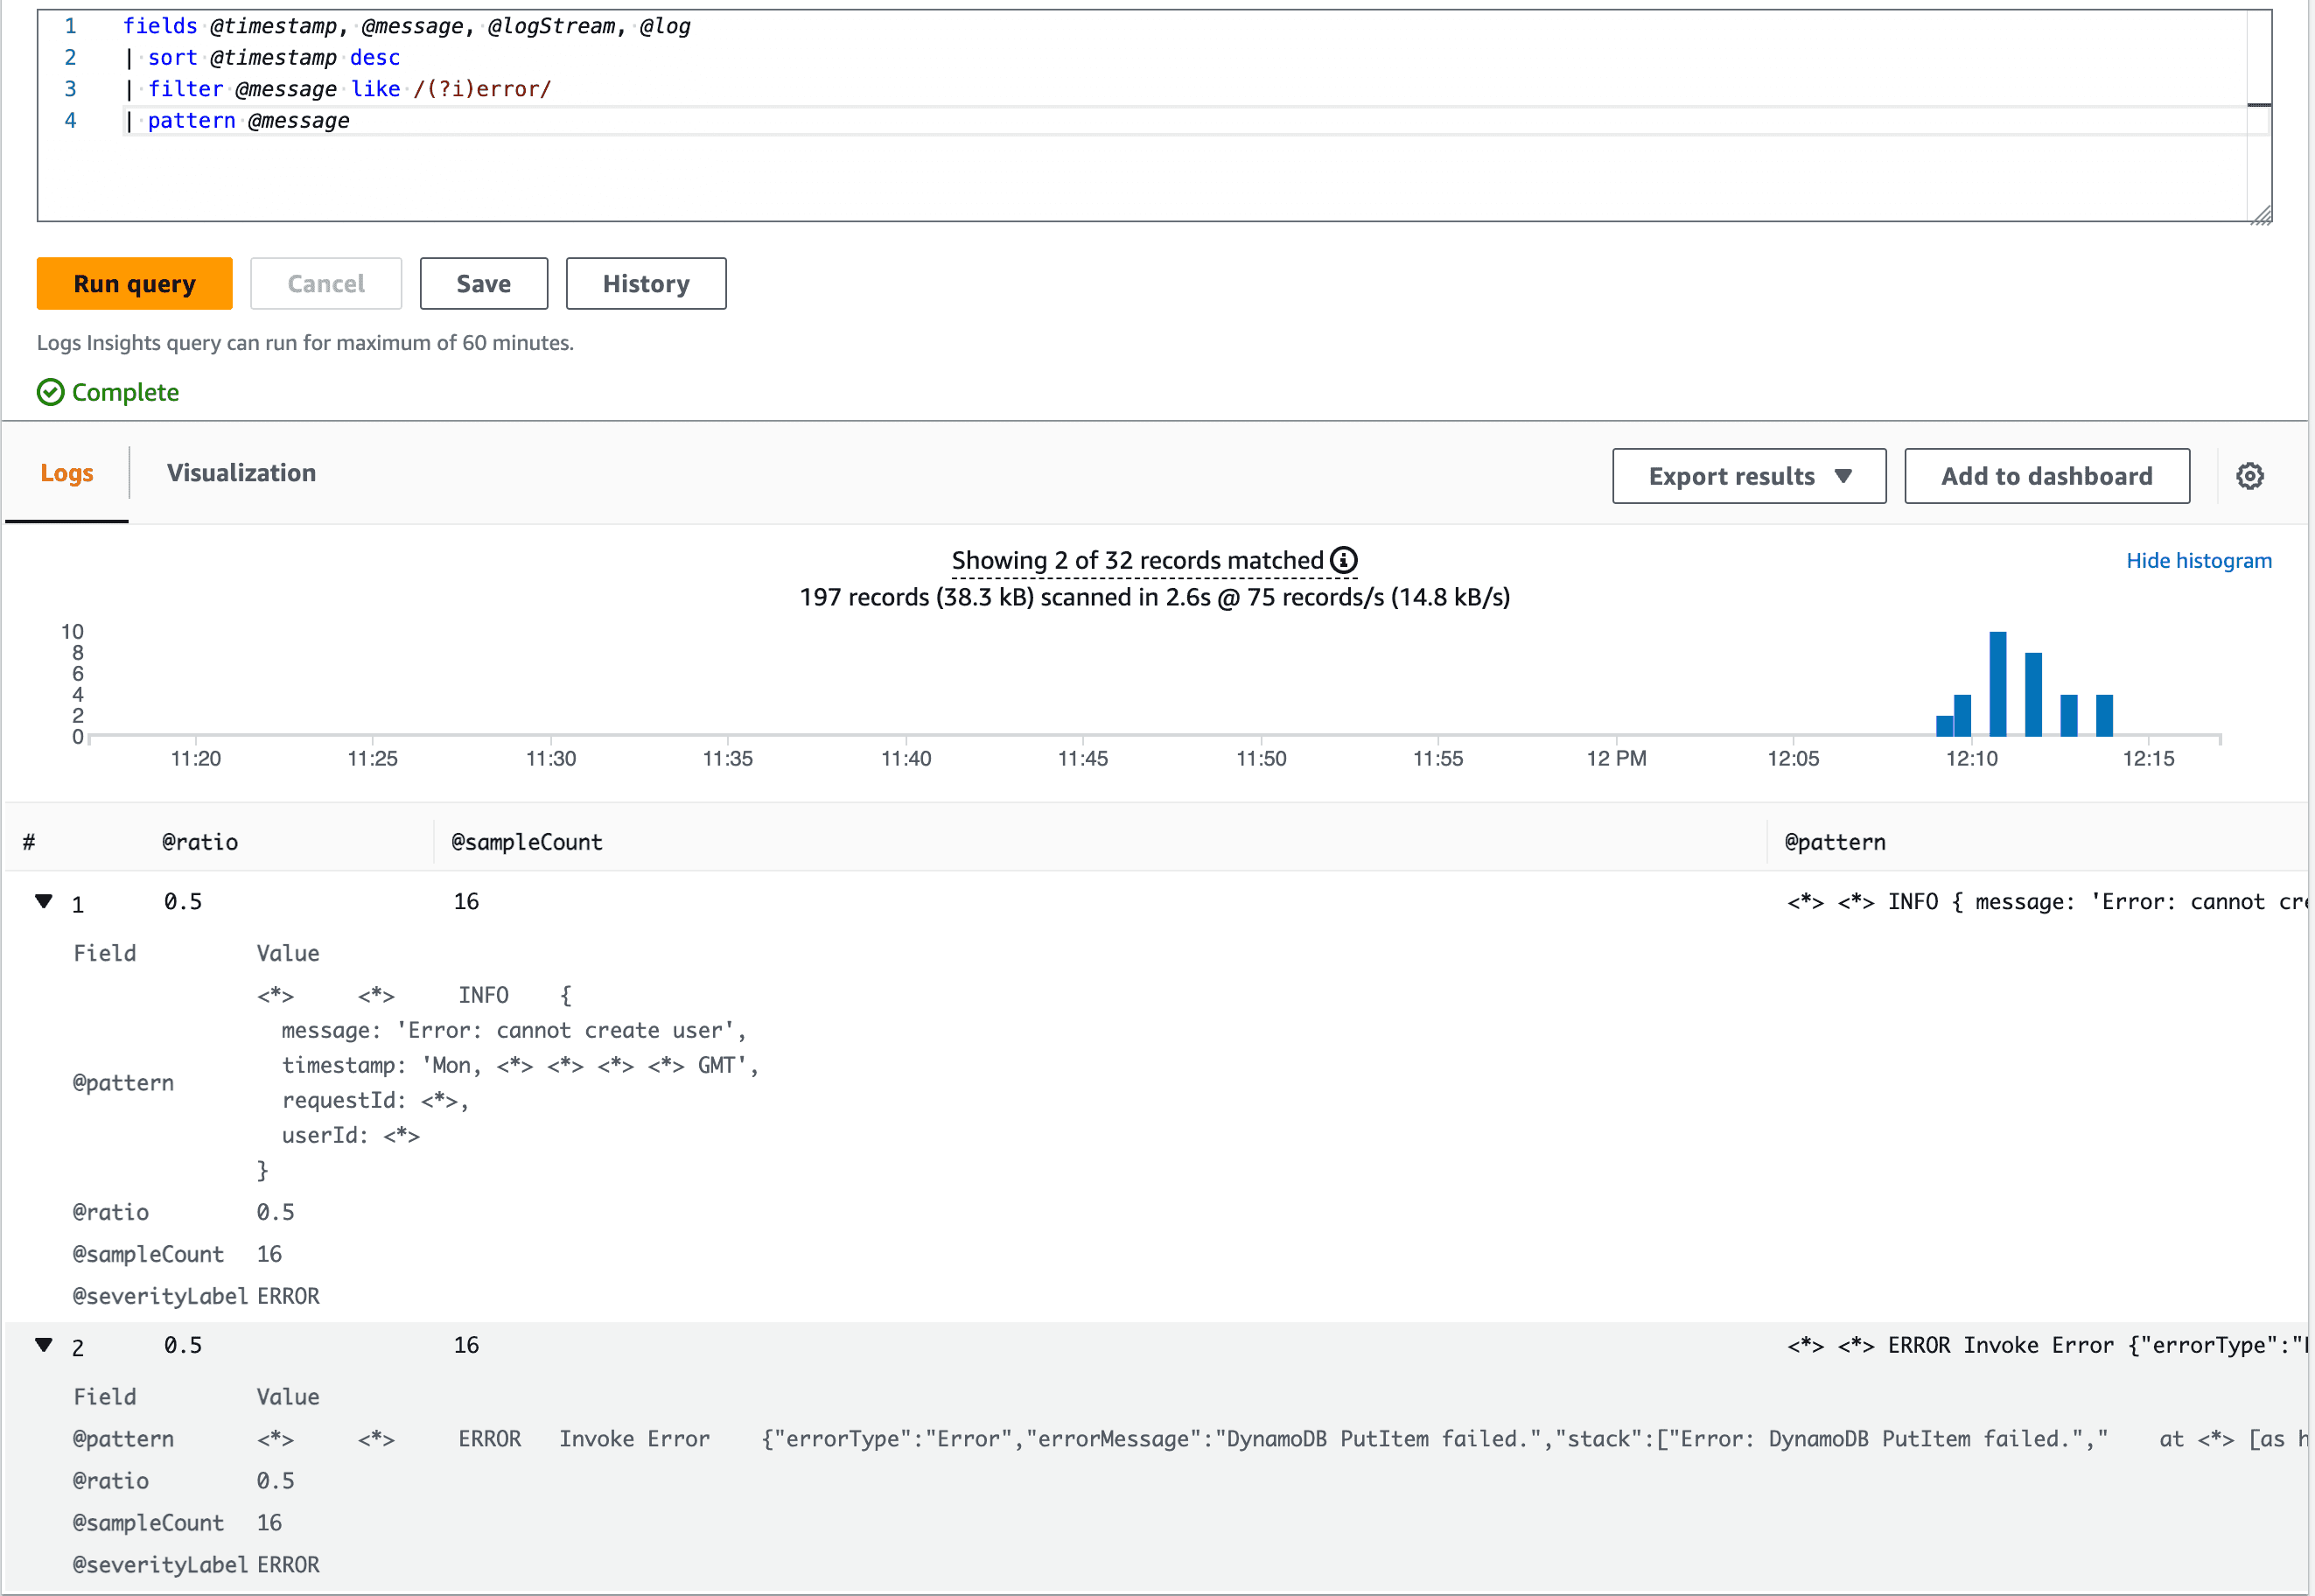
fields @timestamp, @message, @logStream, @log
| sort @timestamp desc
| filter @message like /(?i)error/
| pattern @message # this is new!

This is more like it! Instead of getting tons of very similar log lines, CloudWatch managed to uncover patterns in our @message field and group them together.
For instance, a following log entry:
2023-10-16T10:13:50.458Z	b32f908e-c884-4803-b496-33099d173f99	INFO	{
  message: 'Error: cannot create user',
  timestamp: 'Mon, 16 Oct 2023 10:13:50 GMT',
  requestId: '275828cf-9315-4bbd-8de4-a40555be8fb2',
  userId: '10cf0eb6-96fc-4da3-b135-99e193fe6ed9'
}
is turned into the following after applying the pattern keyword:
<*>	<*>	INFO	{
  message: 'Error: cannot create user',
  timestamp: 'Mon, <*> <*> <*> <*> GMT',
  requestId: <*>,
  userId: <*>
}
As we can see - the pattern keyword is able to identify patterns in our log lines and group them together. This is a huge time saver, especially when you're dealing with a lot of logs. We're no longer seeing unrelevant fields like requestId or userId - we're only seeing the fields that are relevant to us, such as the error message.
With that knowledge we're ready to dig into our codebase and fix the issue.
In the screenshot above you may have noticed other fields such as @ratio, @sampleCount and @severityLabel, let's see what AWS docs have to say about them:
The pattern command produces the following output:
@pattern: A shared text structure that recurs among your log event fields. Fields that vary within a pattern, such as a request ID or timestamp, are represented by<*>. For example,[INFO] Request time: <*>ms is a potential output for the log message[INFO] Request time: 327 ms.
@ratio: The ratio of log events from a selected time period and specified log groups that match an identified pattern. For example, if half of the log events in the selected log groups and time period match the pattern,@ratioreturns 0.50
@sampleCount: A count of the number of log events from a selected time period and specified log groups that match an identified pattern.
@severityLabel: The log severity or level, which indicates the type of information contained in a log. For example, Error, Warning, Info, or Debug.
In conclusion: pattern command is something I'm definitely adding to my workflow and my only wish is that it was available sooner. It's a huge time saver and it can help you get to the root cause of the issue much faster.
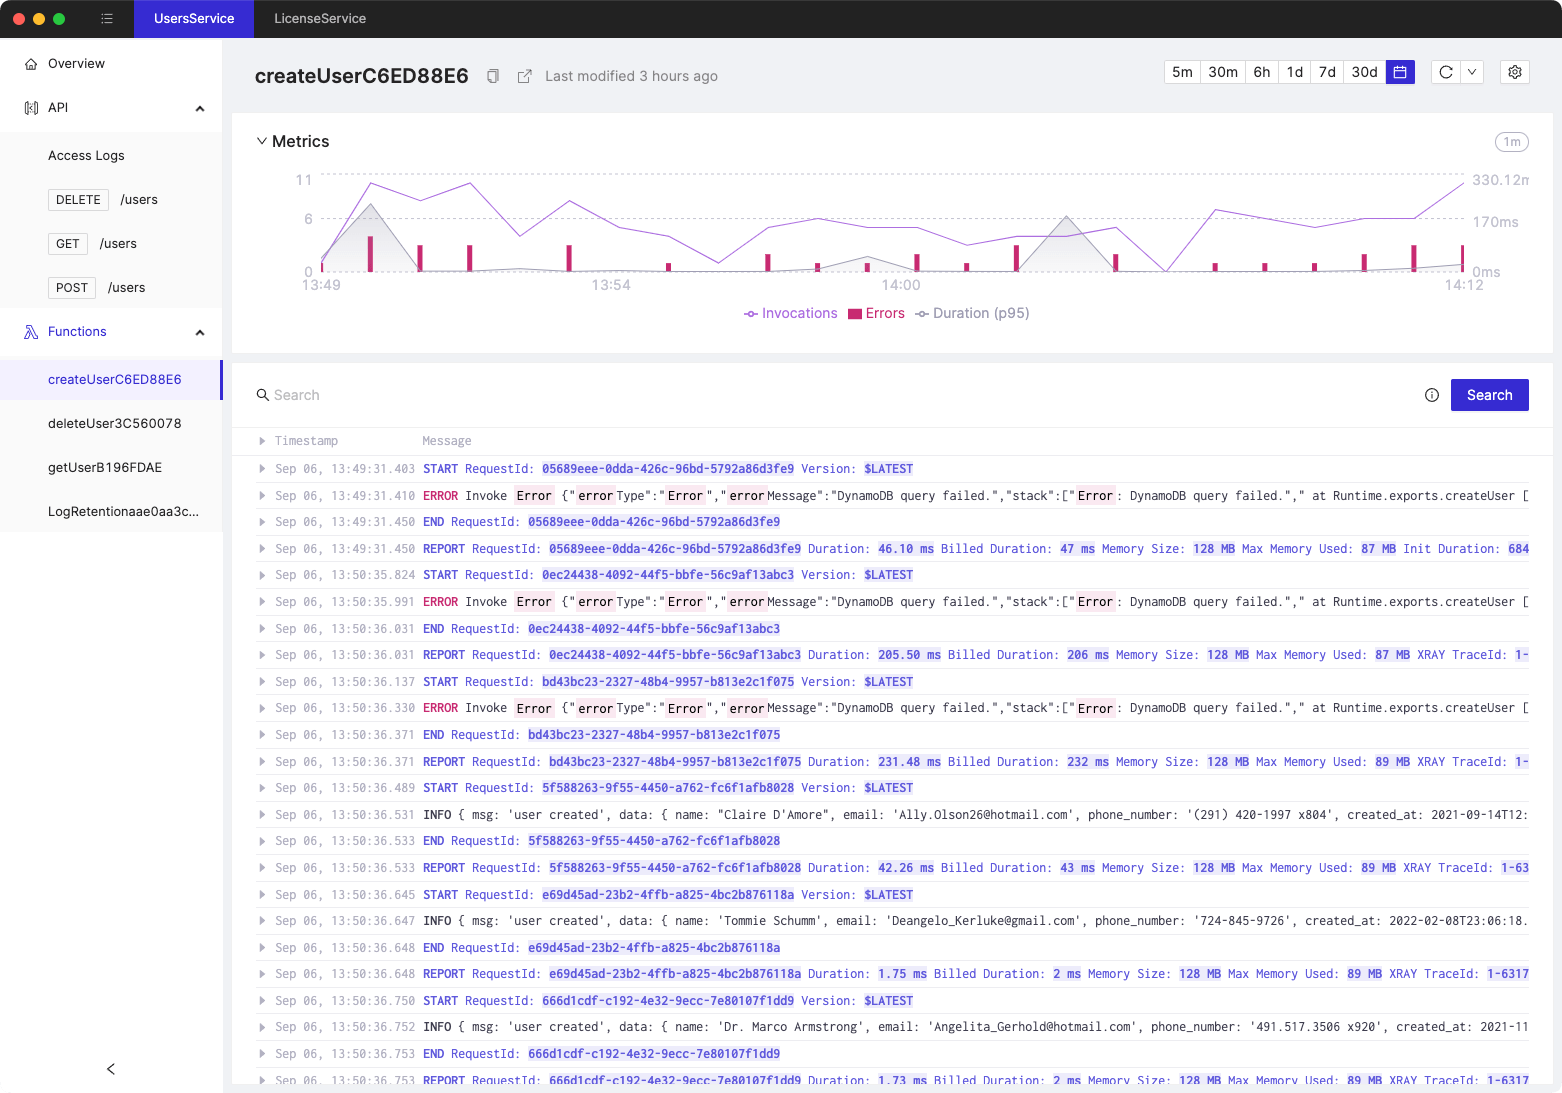
Tired of switching between AWS console tabs? 😒
Cloudash provides clear access to CloudWatch logs and metrics, to help you make quicker decisions.
Try it for free:
