10 CloudWatch Logs Insights examples for serverless applications
- Authors

- Name
- Tomasz Łakomy
- @tlakomy
CloudWatch Logs Insights is a CloudWatch feature that allows you to interactively search and analyze your log data in Amazon CloudWatch Logs. You can perform queries to help you more efficiently and effectively respond to operational issues, diagnose problems, and troubleshoot application performance.
CloudWatch Logs Insights syntax can be difficult to learn, that's why this post contains 10 CloudWatch Logs Insights examples for serverless applications we find useful in our daily work as serverless engineers.
Find all logs for a given request ID or X-Ray trace ID
fields @timestamp, @message
| filter @message like /REQUEST_ID_GOES_HERE/
Note: /REQUEST_ID_GOES_HERE/ is a placeholder for the actual request ID/xRayTraceId you want to search for. Bear in mind that /something/ is a regular expression.
Find 50 most recent errors
fields Timestamp, LogLevel, Message
| filter LogLevel == "ERR"
| sort @timestamp desc
| limit 50
Find the most expensive Lambda function invocations
filter @type = "REPORT"
| fields @requestId, @billedDuration
| sort by @billedDuration desc
View latency stats for 5-minute intervals for a Lambda function
filter @type = "REPORT"
| stats avg(@duration), max(@duration), min(@duration) by bin(5m)
Determine the amount of overprovisioned memory for a Lambda function
filter @type = "REPORT"
| stats max(@memorySize / 1024 / 1024) as provisonedMemoryMB,
  min(@maxMemoryUsed / 1024 / 1024) as smallestMemoryRequestMB,
  avg(@maxMemoryUsed / 1024 / 1024) as avgMemoryUsedMB,
  max(@maxMemoryUsed / 1024 / 1024) as maxMemoryUsedMB,
  provisonedMemoryMB - maxMemoryUsedMB as overProvisionedMB
Note:
Lambda allocates CPU power in proportion to the amount of memory configured. Memory is the amount of memory available to your Lambda function at runtime. You can increase or decrease the memory and CPU power allocated to your function using the Memory (MB) setting.
Find a non-200 error in API Gateway Execution Logs
fields @timestamp, @message, @requestId, @duration, @xrayTraceId, @logStream, @logStream
| filter
   @message like /fail/ or
   @message like /timed/ or
   @message like /X-Amz-Function-Error/ or
   @message like /tatus: 4/ or
   @message like /tatus: 5/
| sort @timestamp desc
Count a number of cold starts, average init time and maximum init duration of a Lambda function
filter @type="REPORT"
| fields @memorySize / 1000000 as memorySize
| filter @message like /(?i)(Init Duration)/
| parse @message /^REPORT.*Init Duration: (?<initDuration>.*) ms.*/
| parse @log /^.*\/aws\/lambda\/(?<functionName>.*)/
| stats count() as coldStarts, avg(initDuration) as avgInitDuration, max(initDuration) as maxIntDuration by functionName, memorySize
Lambda cold start percentage over time
filter @type = "REPORT"
| stats
  sum(strcontains(
    @message,
    "Init Duration"))
  / count(*)
  * 100
  as coldStartPercentage,
  avg(@duration)
  by bin(5m)
Credit: https://github.com/julianwood/serverless-cloudwatch-logs-insights-examples
Show average duration, max duration, min duration, P99 percentile duration and request count
filter @type = "REPORT"
| stats avg(@duration), max(@duration), min(@duration), pct(@duration, 99), count(@duration) by bin(5m)
Exclude informational logs to highlight only Lambda errors
fields @timestamp, @message
| sort @timestamp desc
| filter @message not like 'EXTENSION'
| filter @message not like 'Lambda Insights'
| filter @message not like 'INFO'
| filter @message not like 'REPORT'
| filter @message not like 'END'
| filter @message not like 'START'
CloudWatch Logs Insights queries are not free (although there is a free tier). For instance for in us-east-1 AWS will charge you $0.005 per GB of data scanned for a query. Note that according to Amazon CloudWatch FAQ you won't be charged for failed queries and if you cancel a query manually, you are charged for the amount of ingested log data scanned up to the point at which you cancelled the query.
Find out more at https://aws.amazon.com/cloudwatch/pricing/
Tired of switching between AWS console tabs? 😒
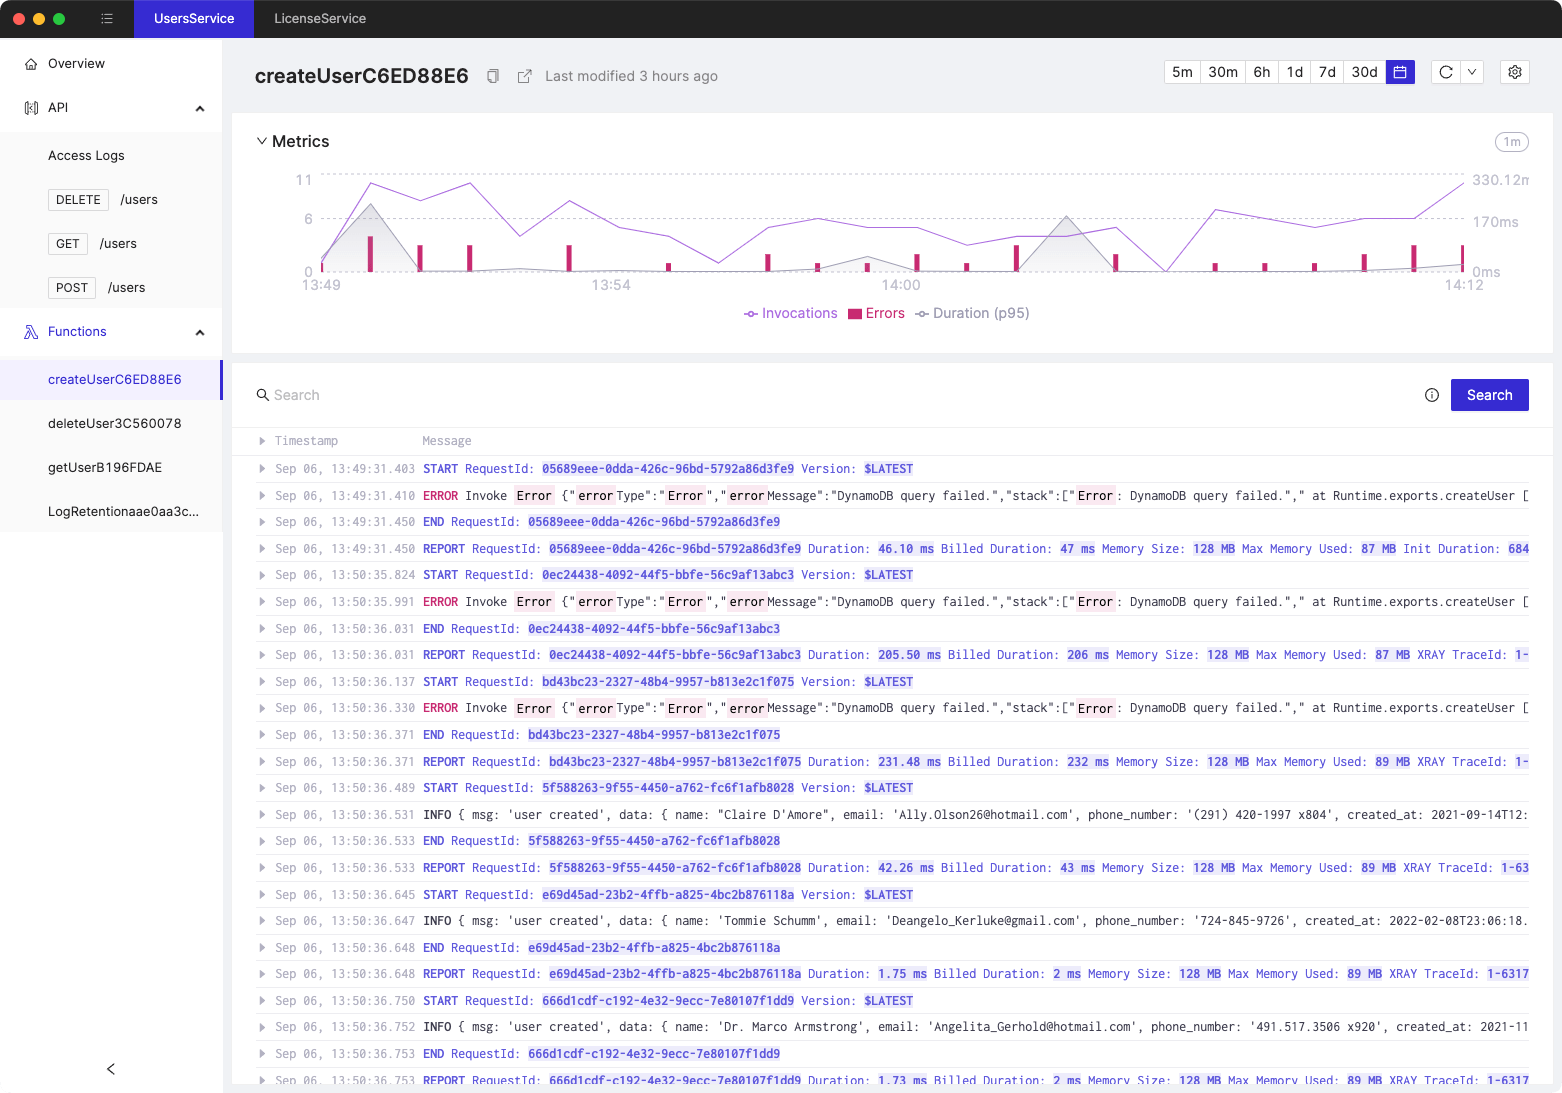
Cloudash provides clear access to CloudWatch logs and metrics, to help you make quicker decisions.
Try it for free:
