Investigate Lambda errors in minutes with Cloudash
- Authors

- Name
- Tomasz Łakomy
- @tlakomy
My Lambda function has an error, what do I do now?
If you've ever tried programming for more than an hour, you've surely encountered an error every now and then. Not all errors are created equal, some may not trigger a CloudWatch alarm, while others will wake you up in the middle of the night (thanks PagerDuty!).
Let's learn how to use Cloudash to see Lambda metrics and CloudWatch logs for an error-prone function in less than 5 minutes.
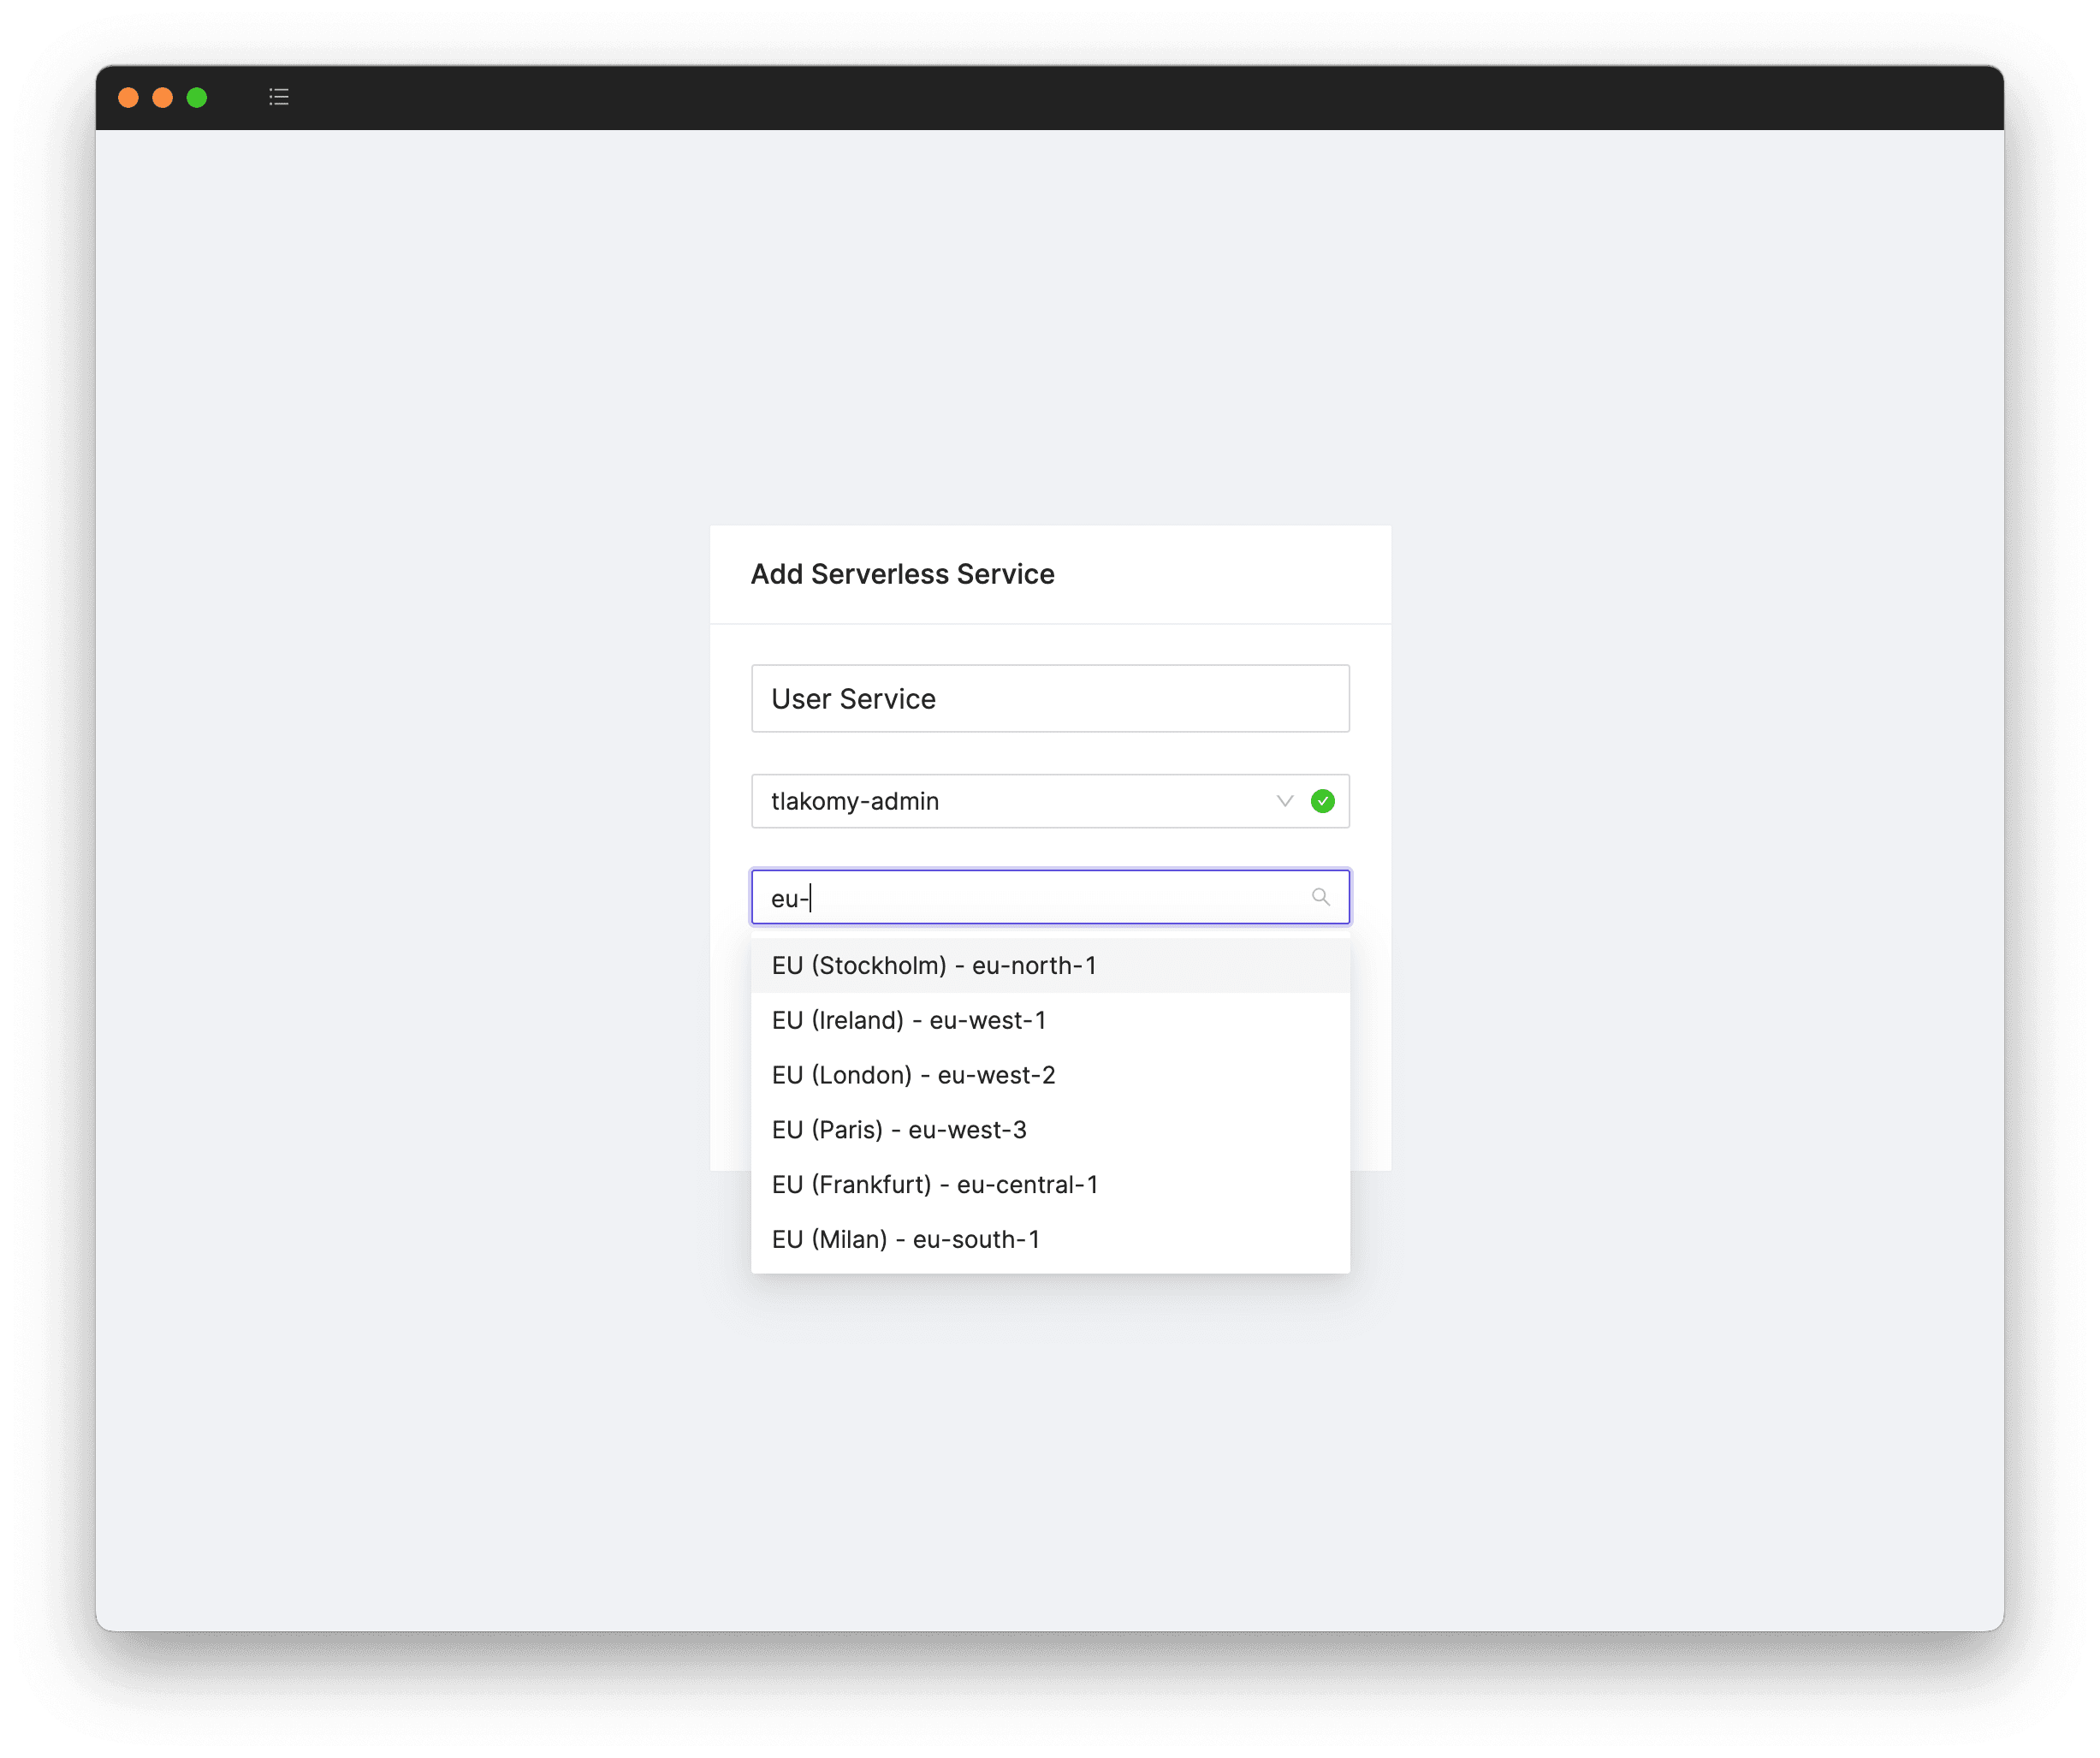
After running Cloudash for the first time, you'll be asked to select a serverless service:
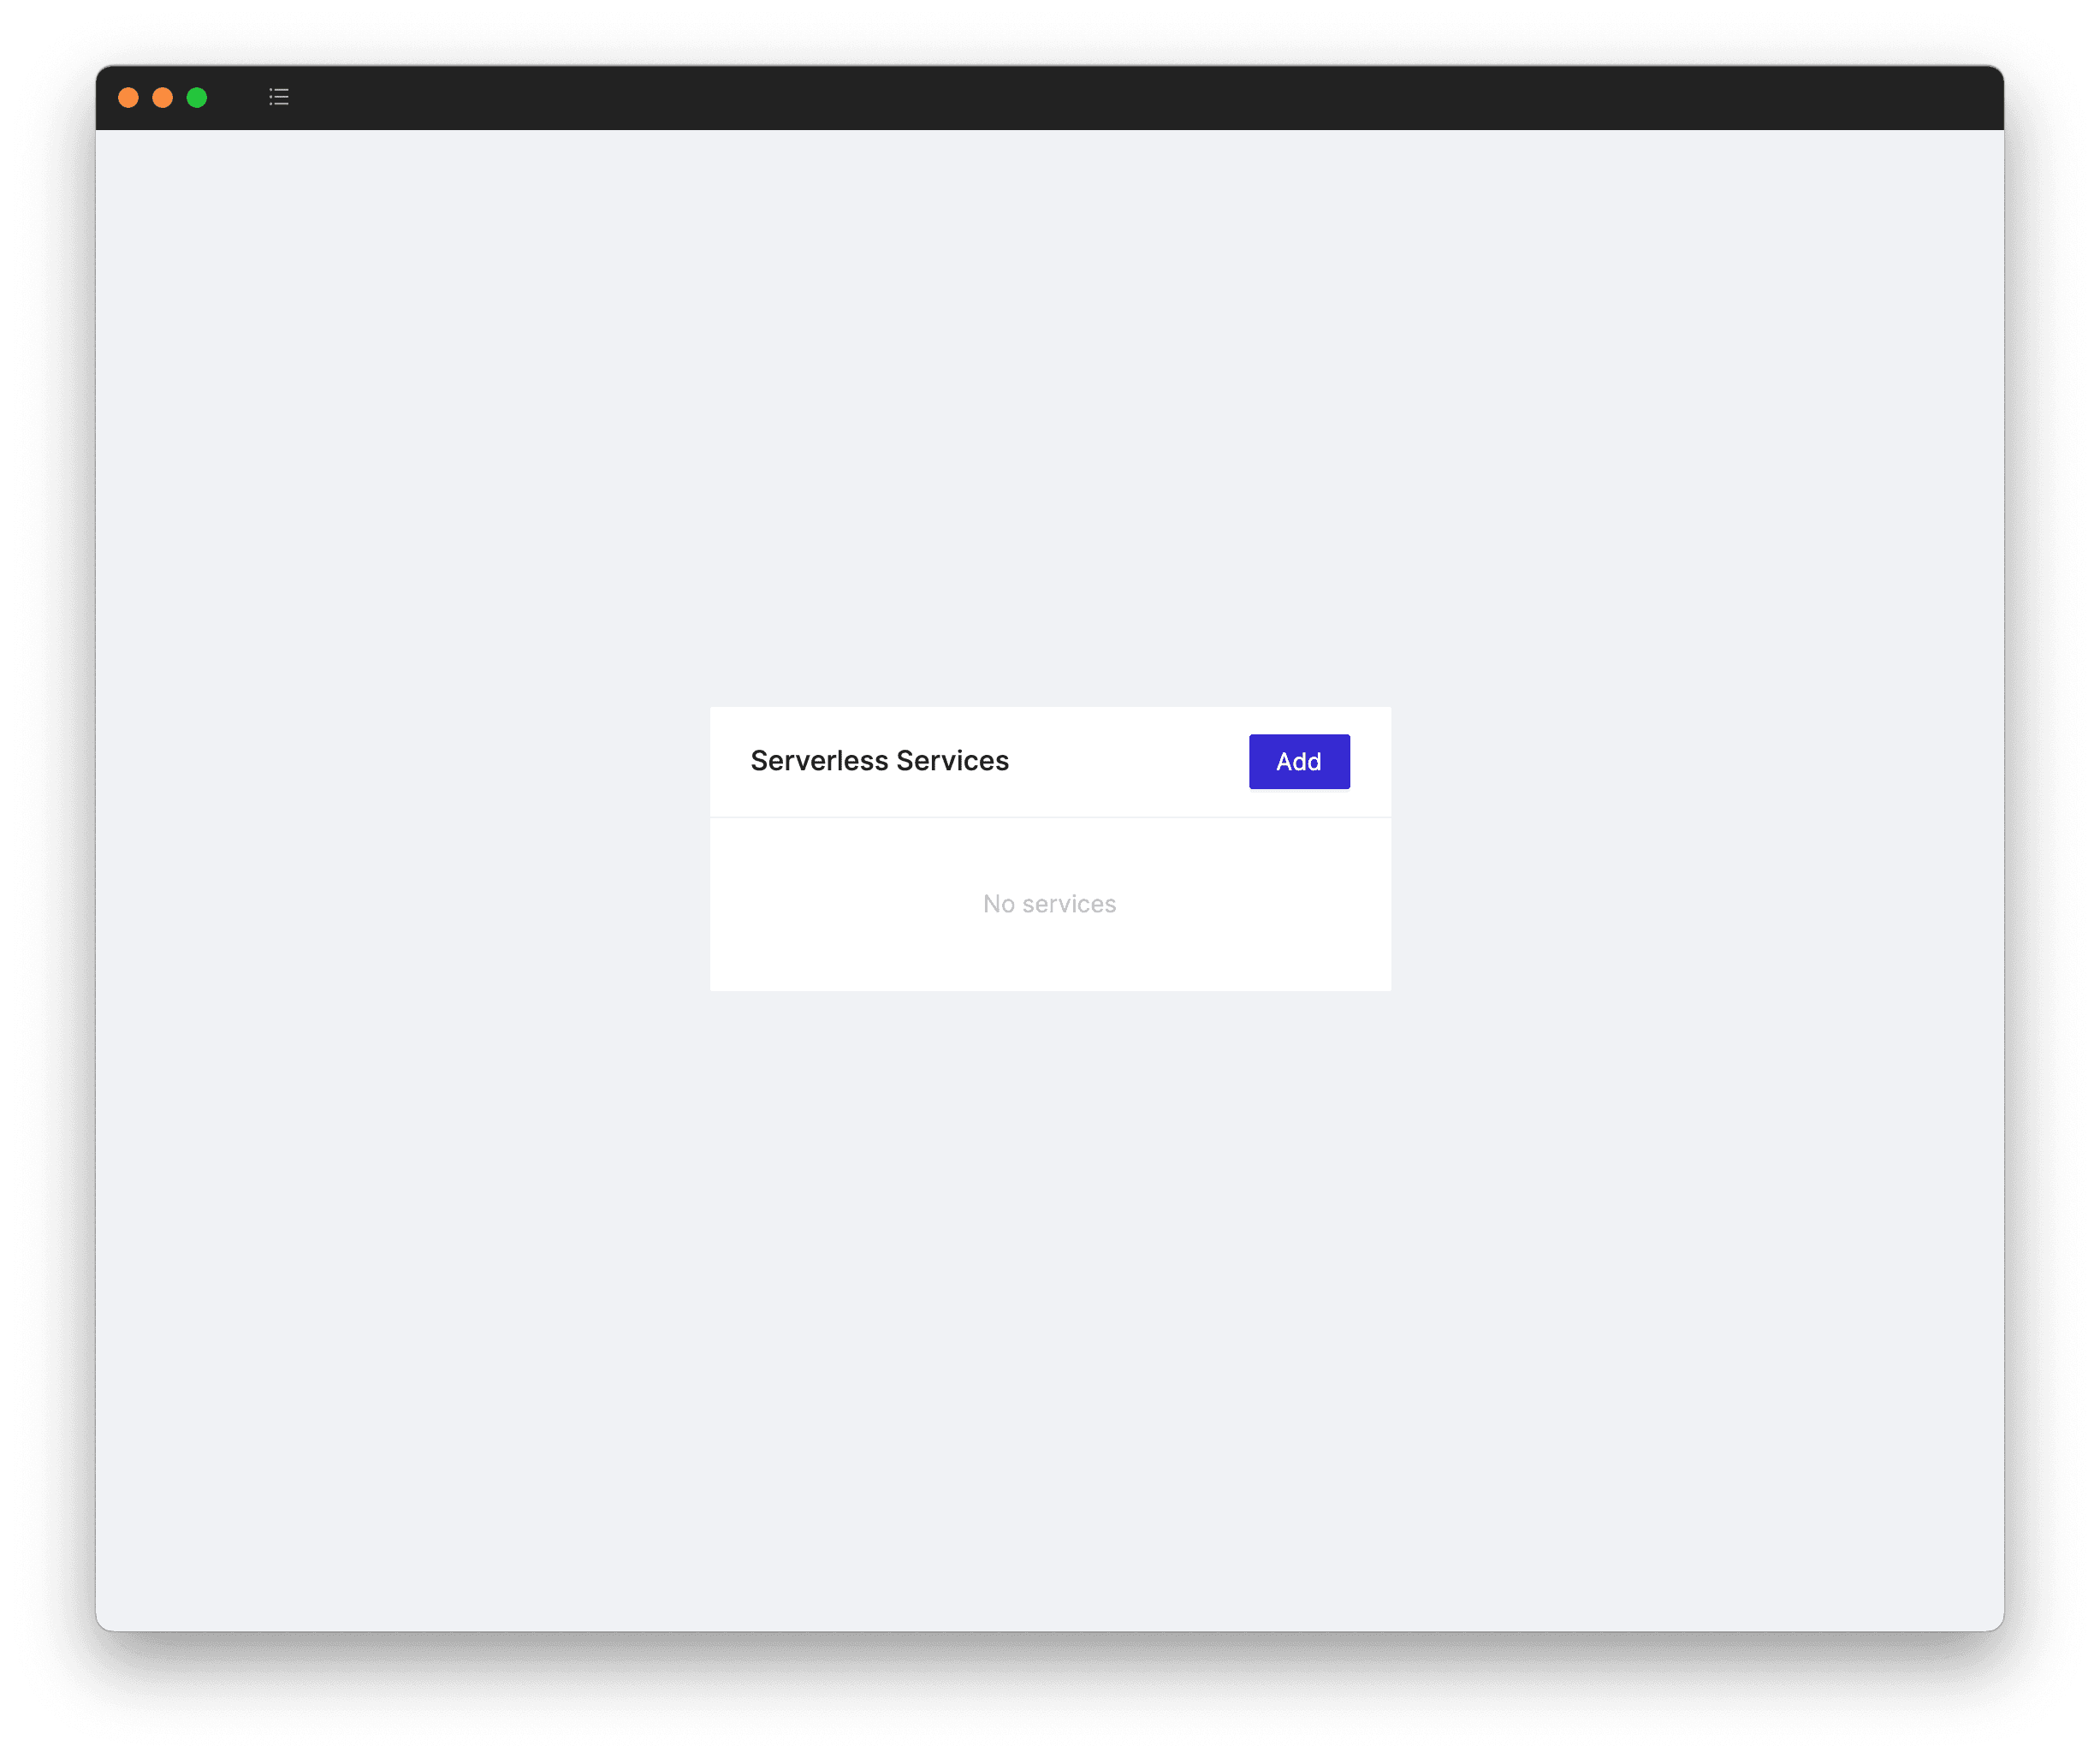
In this example we'll be using an example User Service, but you can use any service you like - no matter if it's a side project or a production-grade enterprise serverless app. In fact, Cloudash ships with full support for AWS CDK, AWS SAM, Serverless Framework or any CloudFormation-compatible framework. After clicking on Add, provide the name of your service:
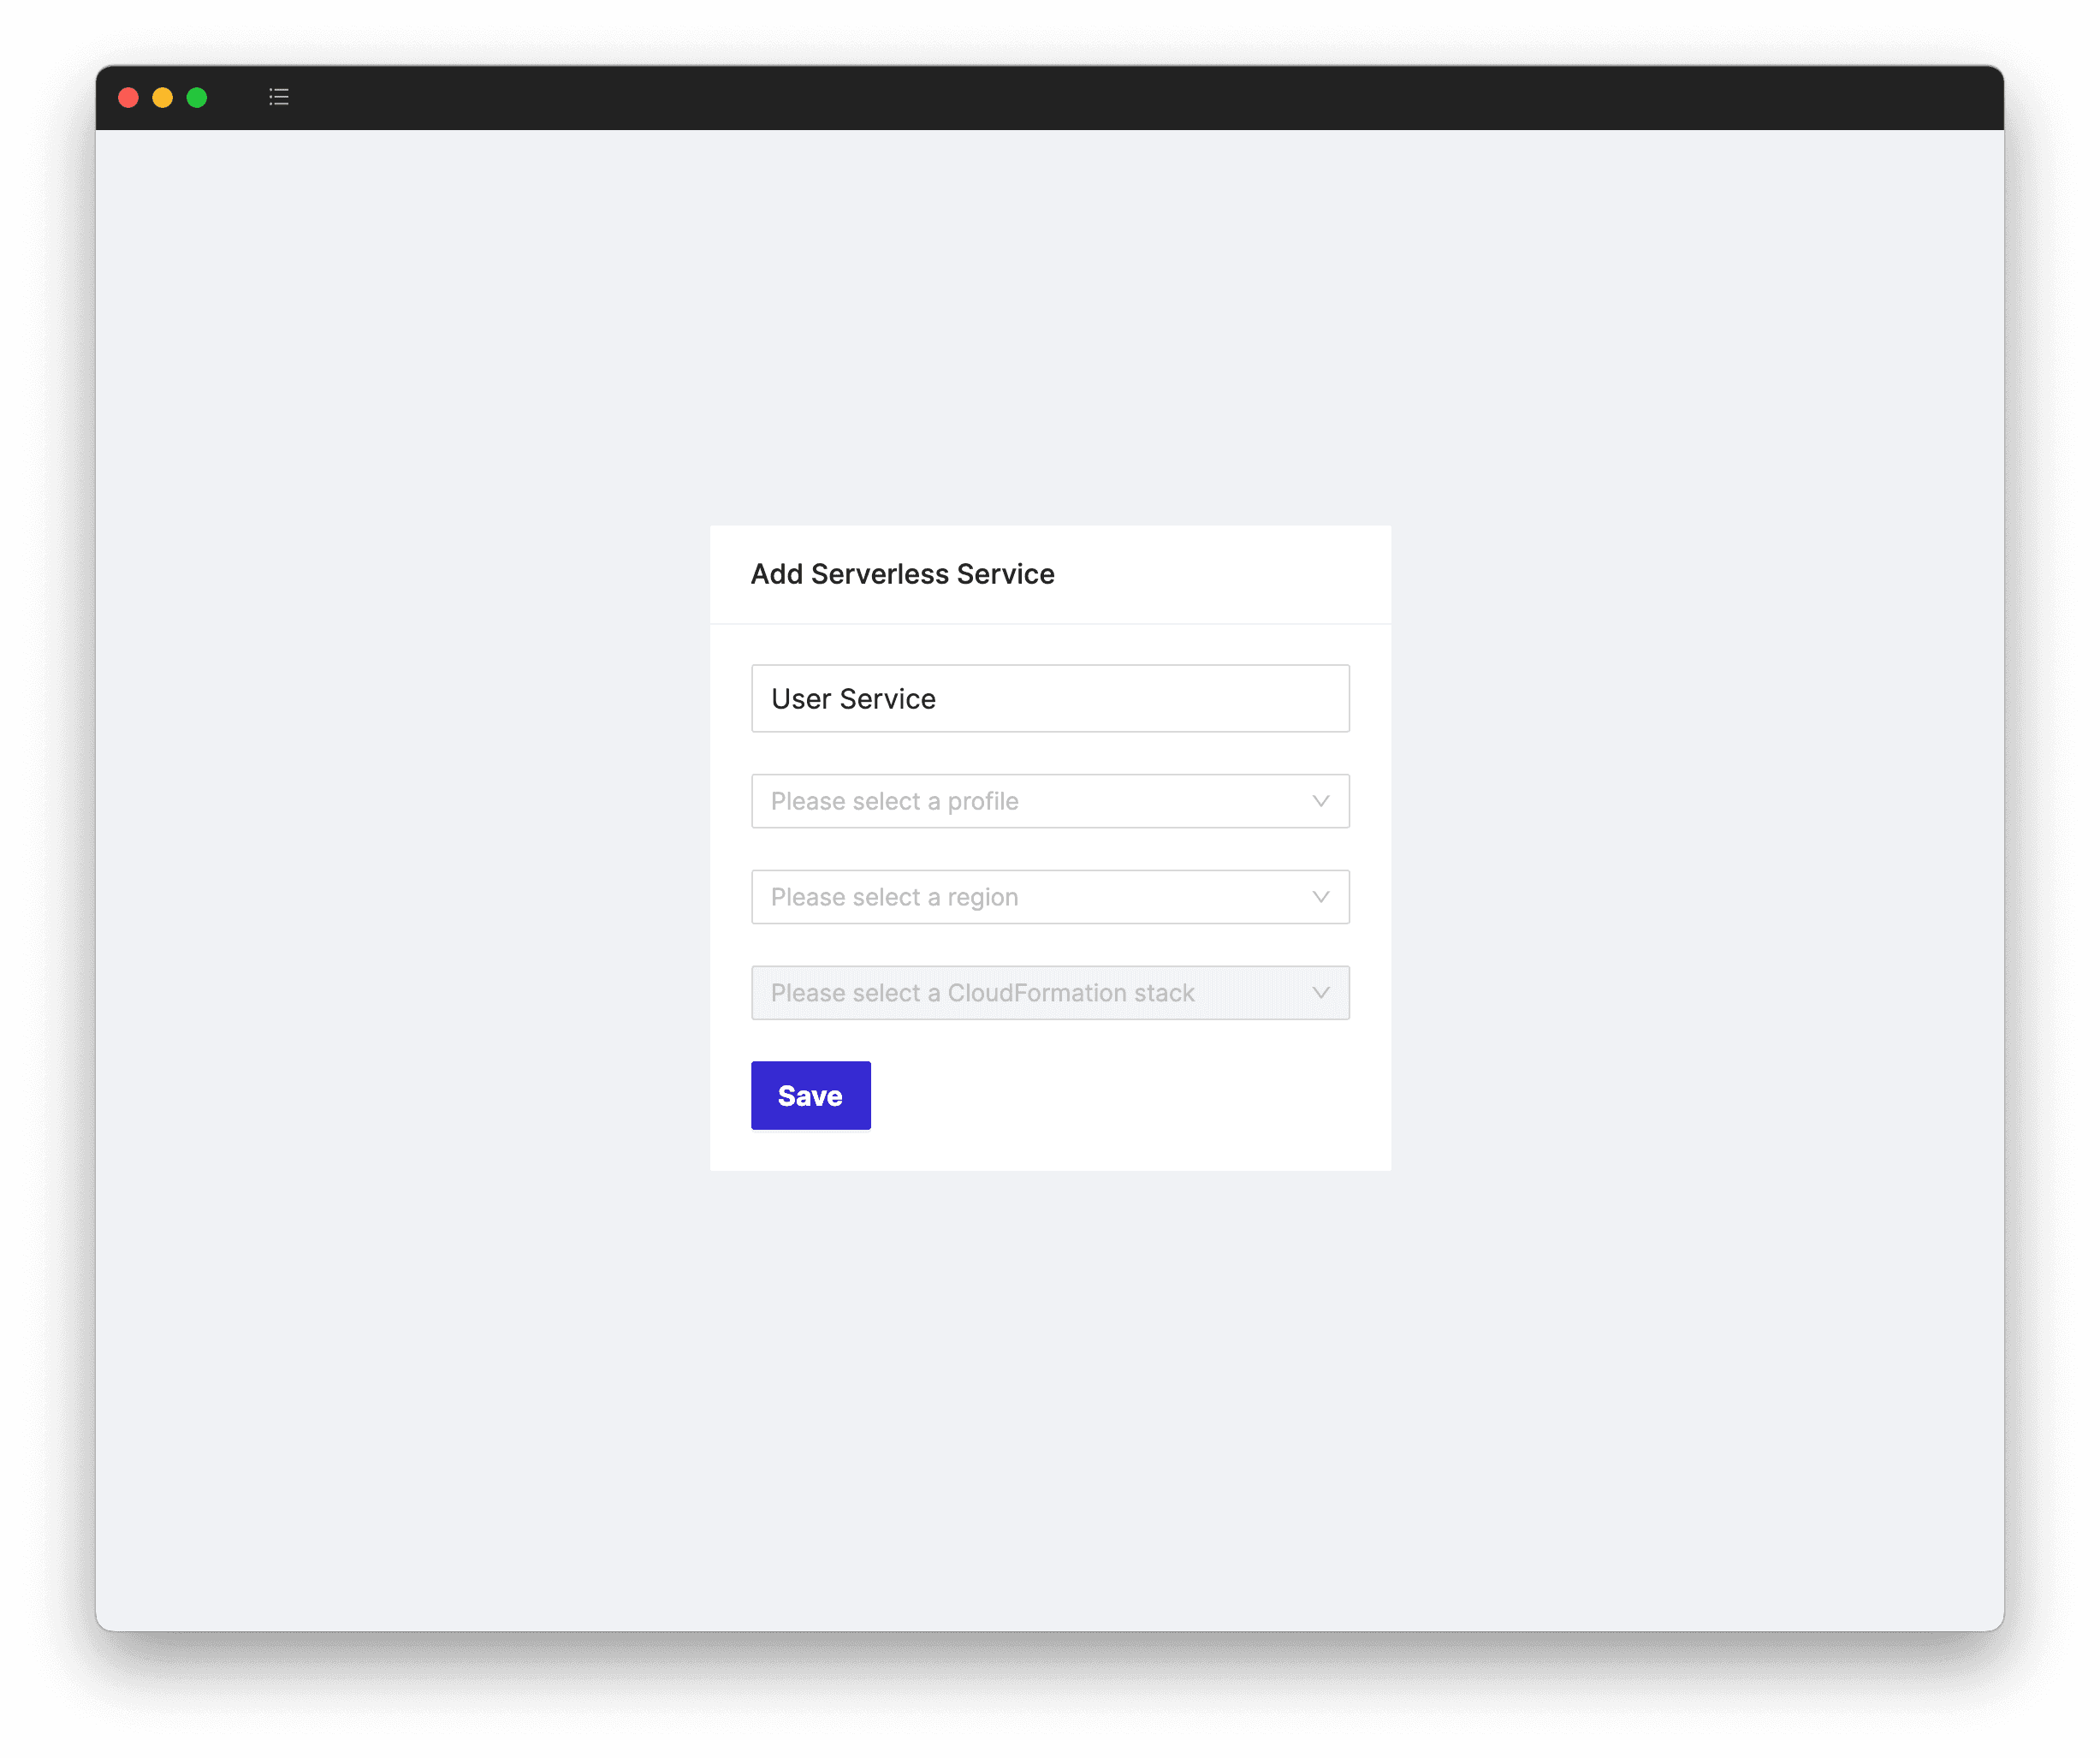
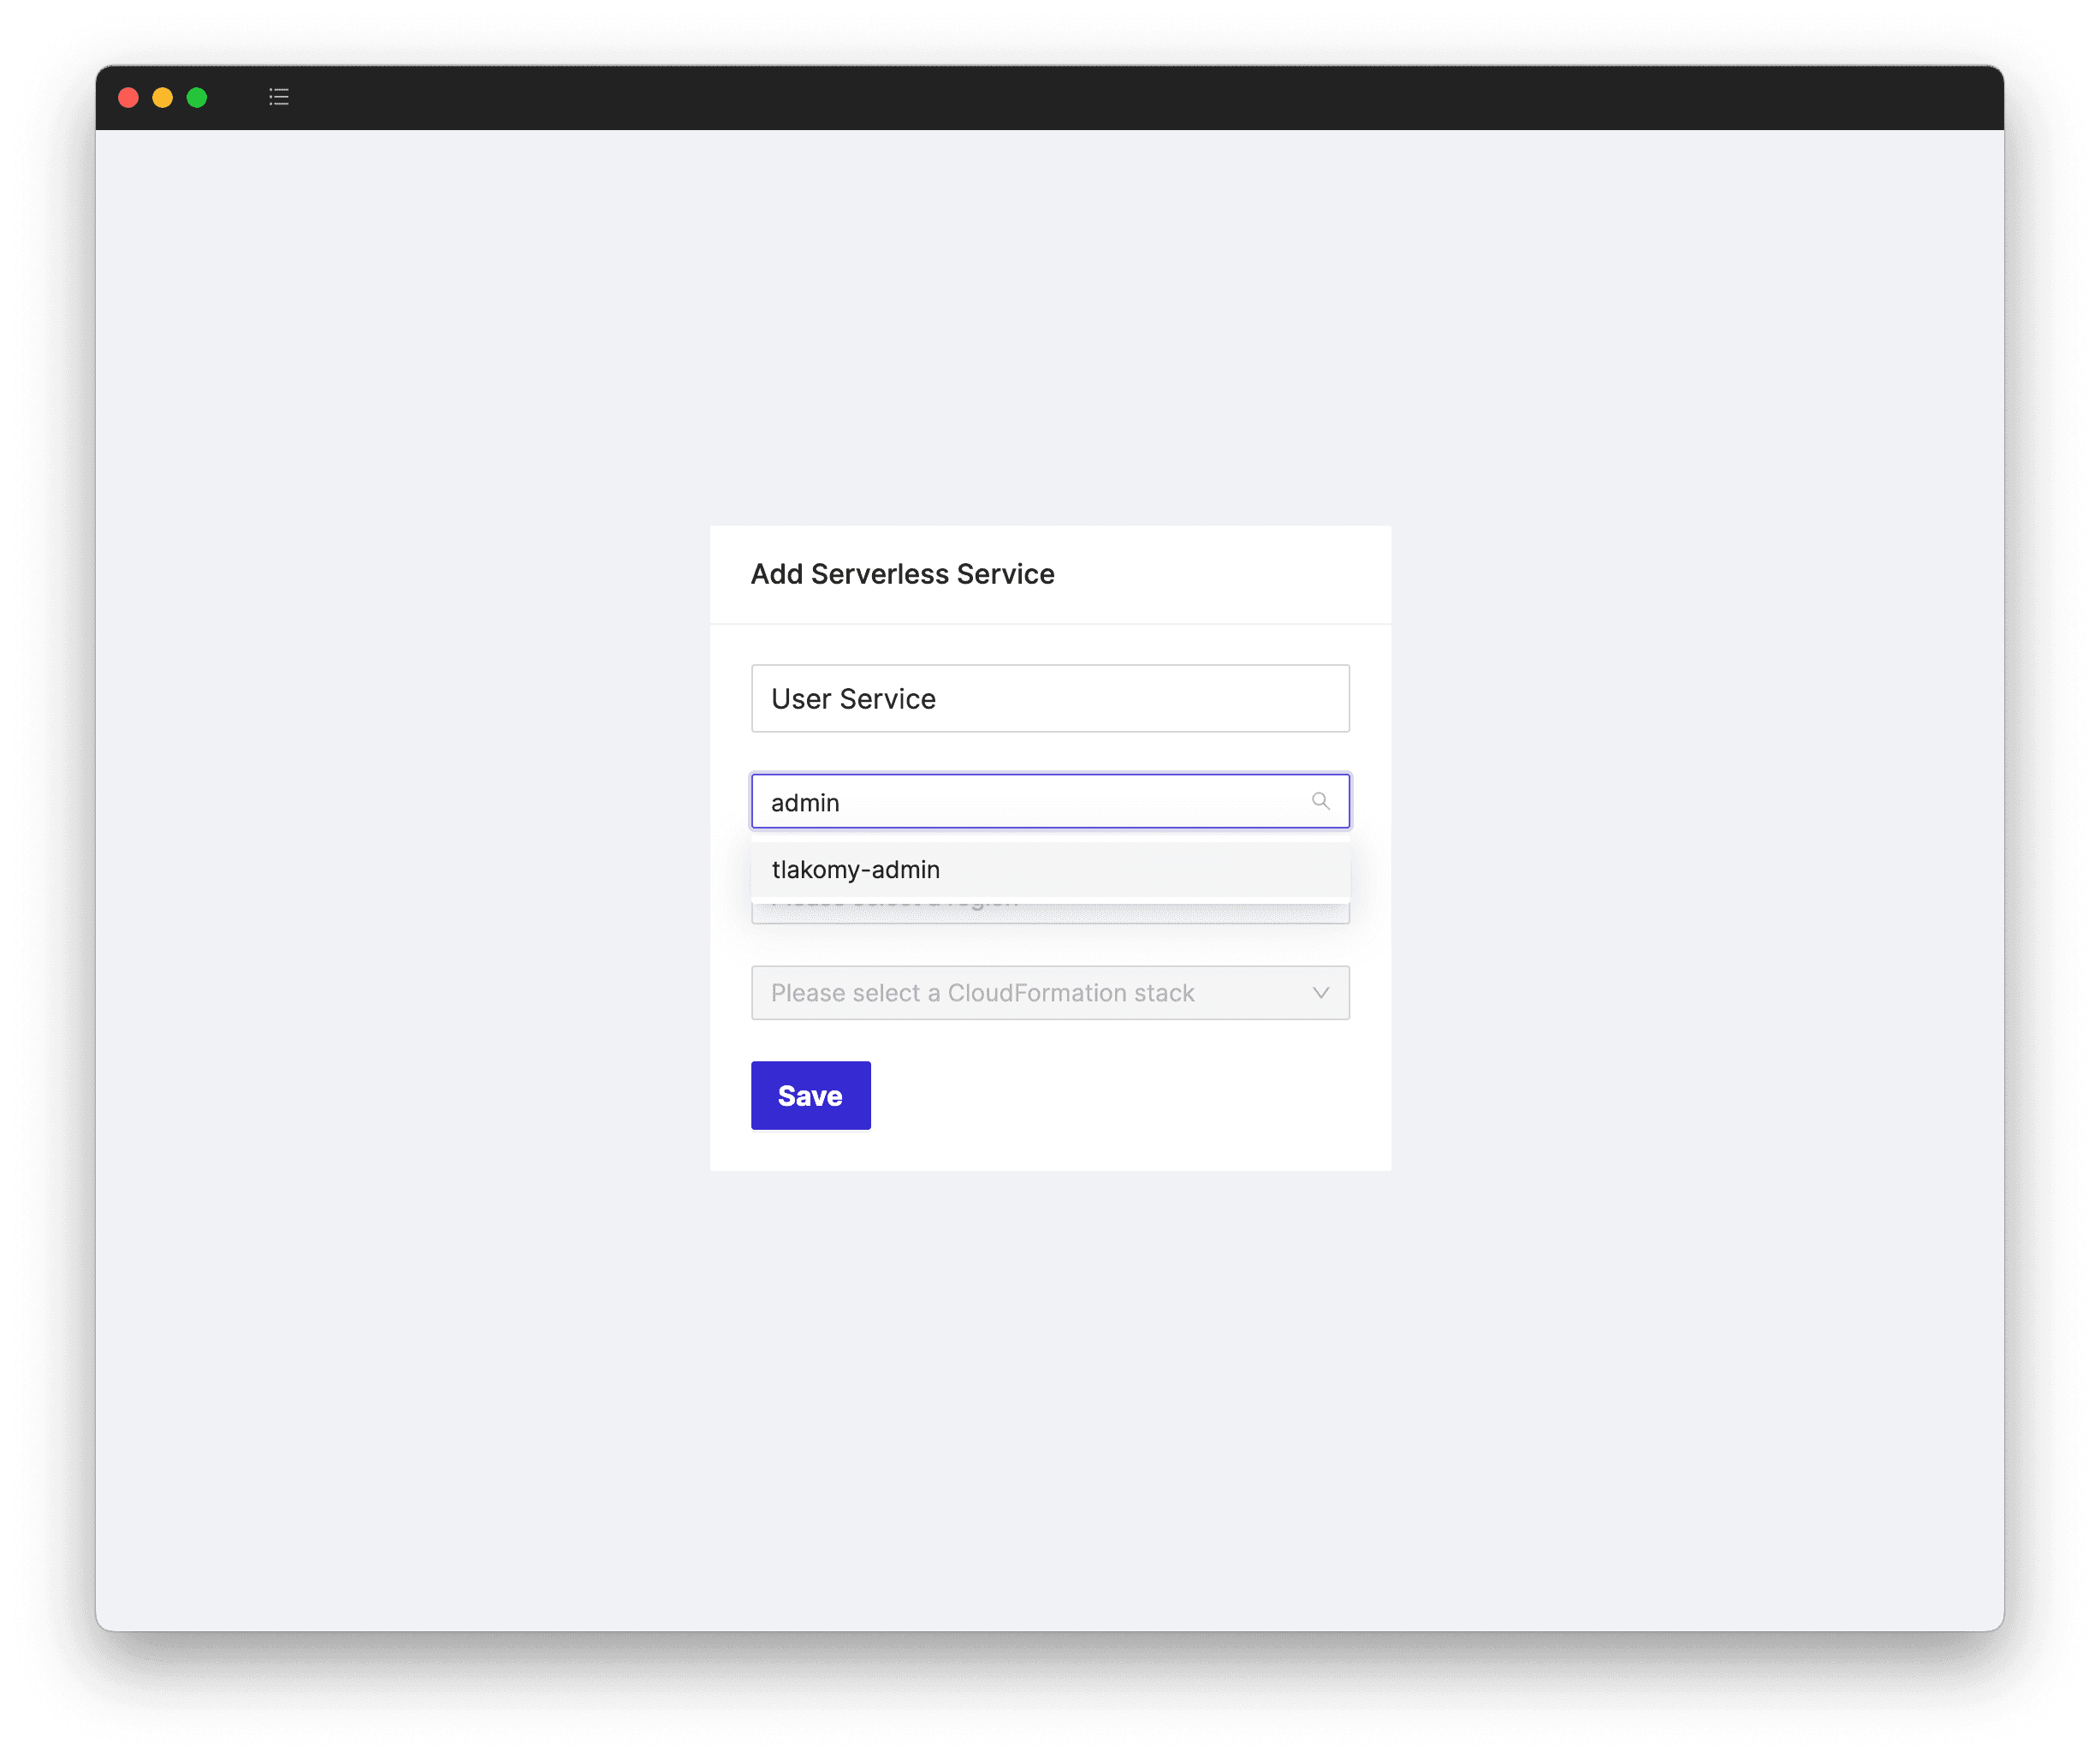
Next, select a profile. Cloudash is smart enough to fetch the profile list from your local AWS credentials, so you don't have to provide it manually. Note that we will never send your credentials anywhere. Whatever happens on your machine, stays on your machine.
Next up, select a region your CloudFormation stack is deployed to. (And yes, we all know it's us-east-1).
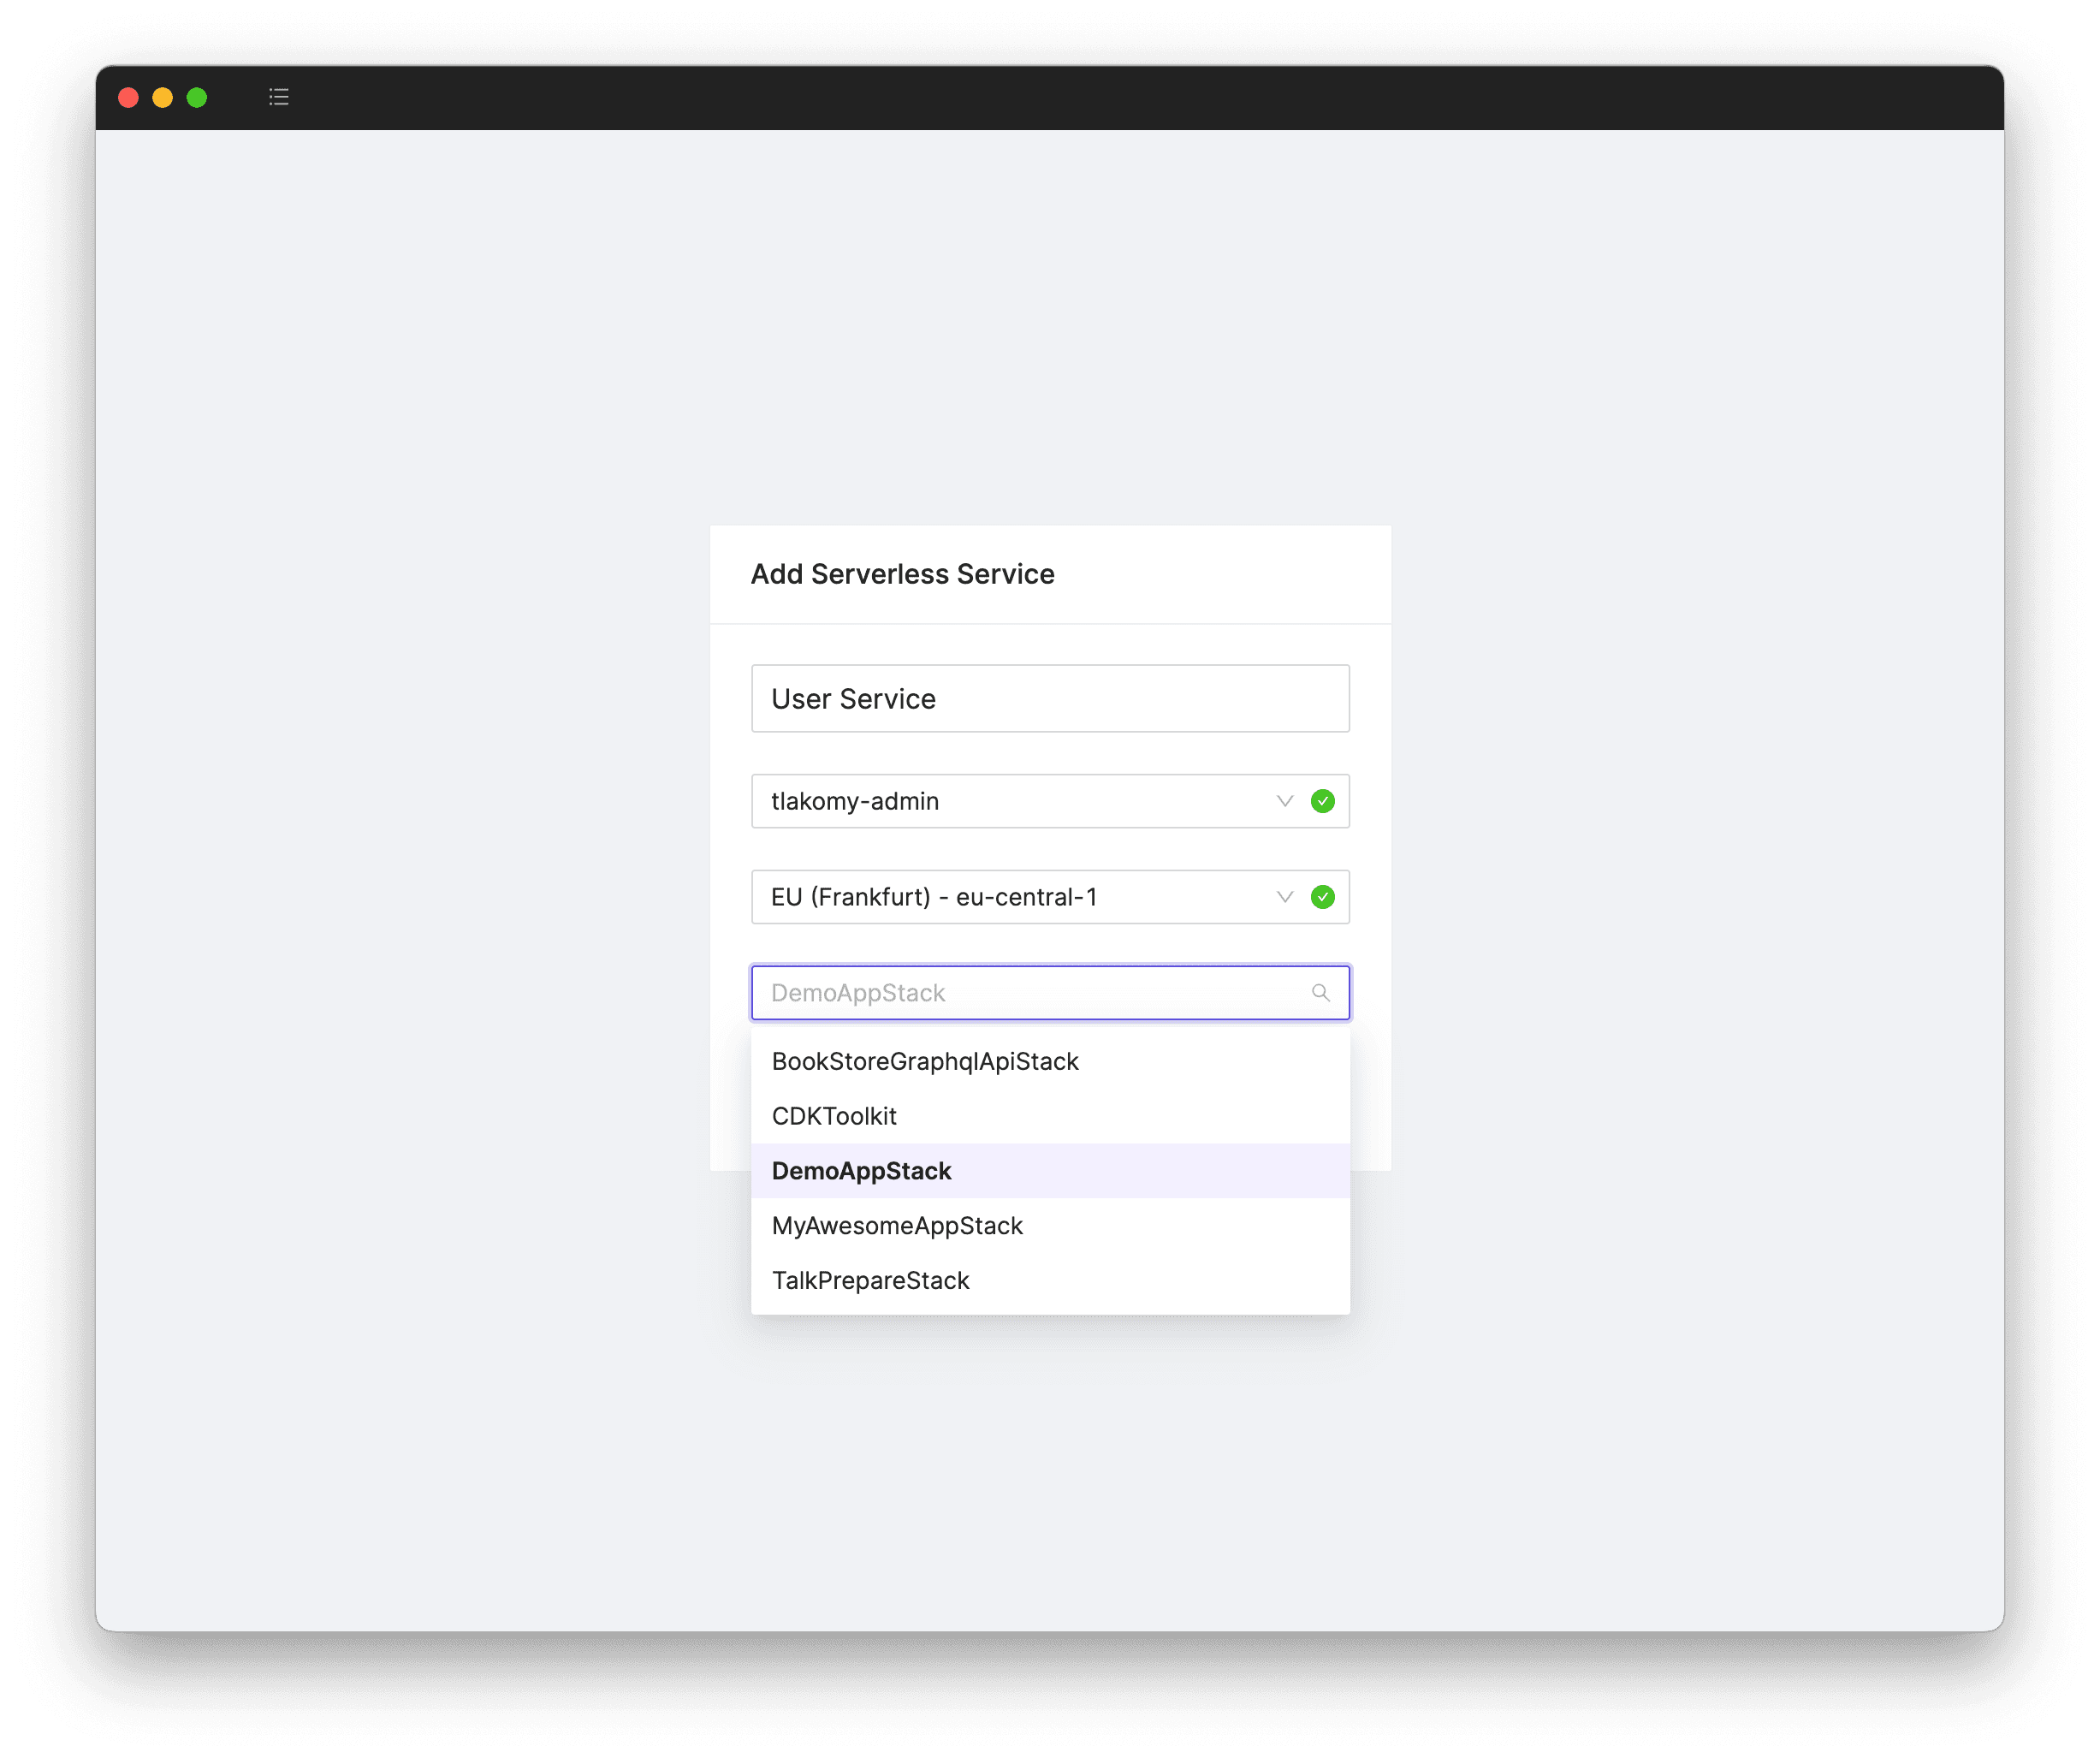
Cloudash will discover all your services on its own - you don't have to do anything. If you're following along, choose your own service, but for the purpose of this post I'm going to select my very own DemoAppStack CloudFormation stack.
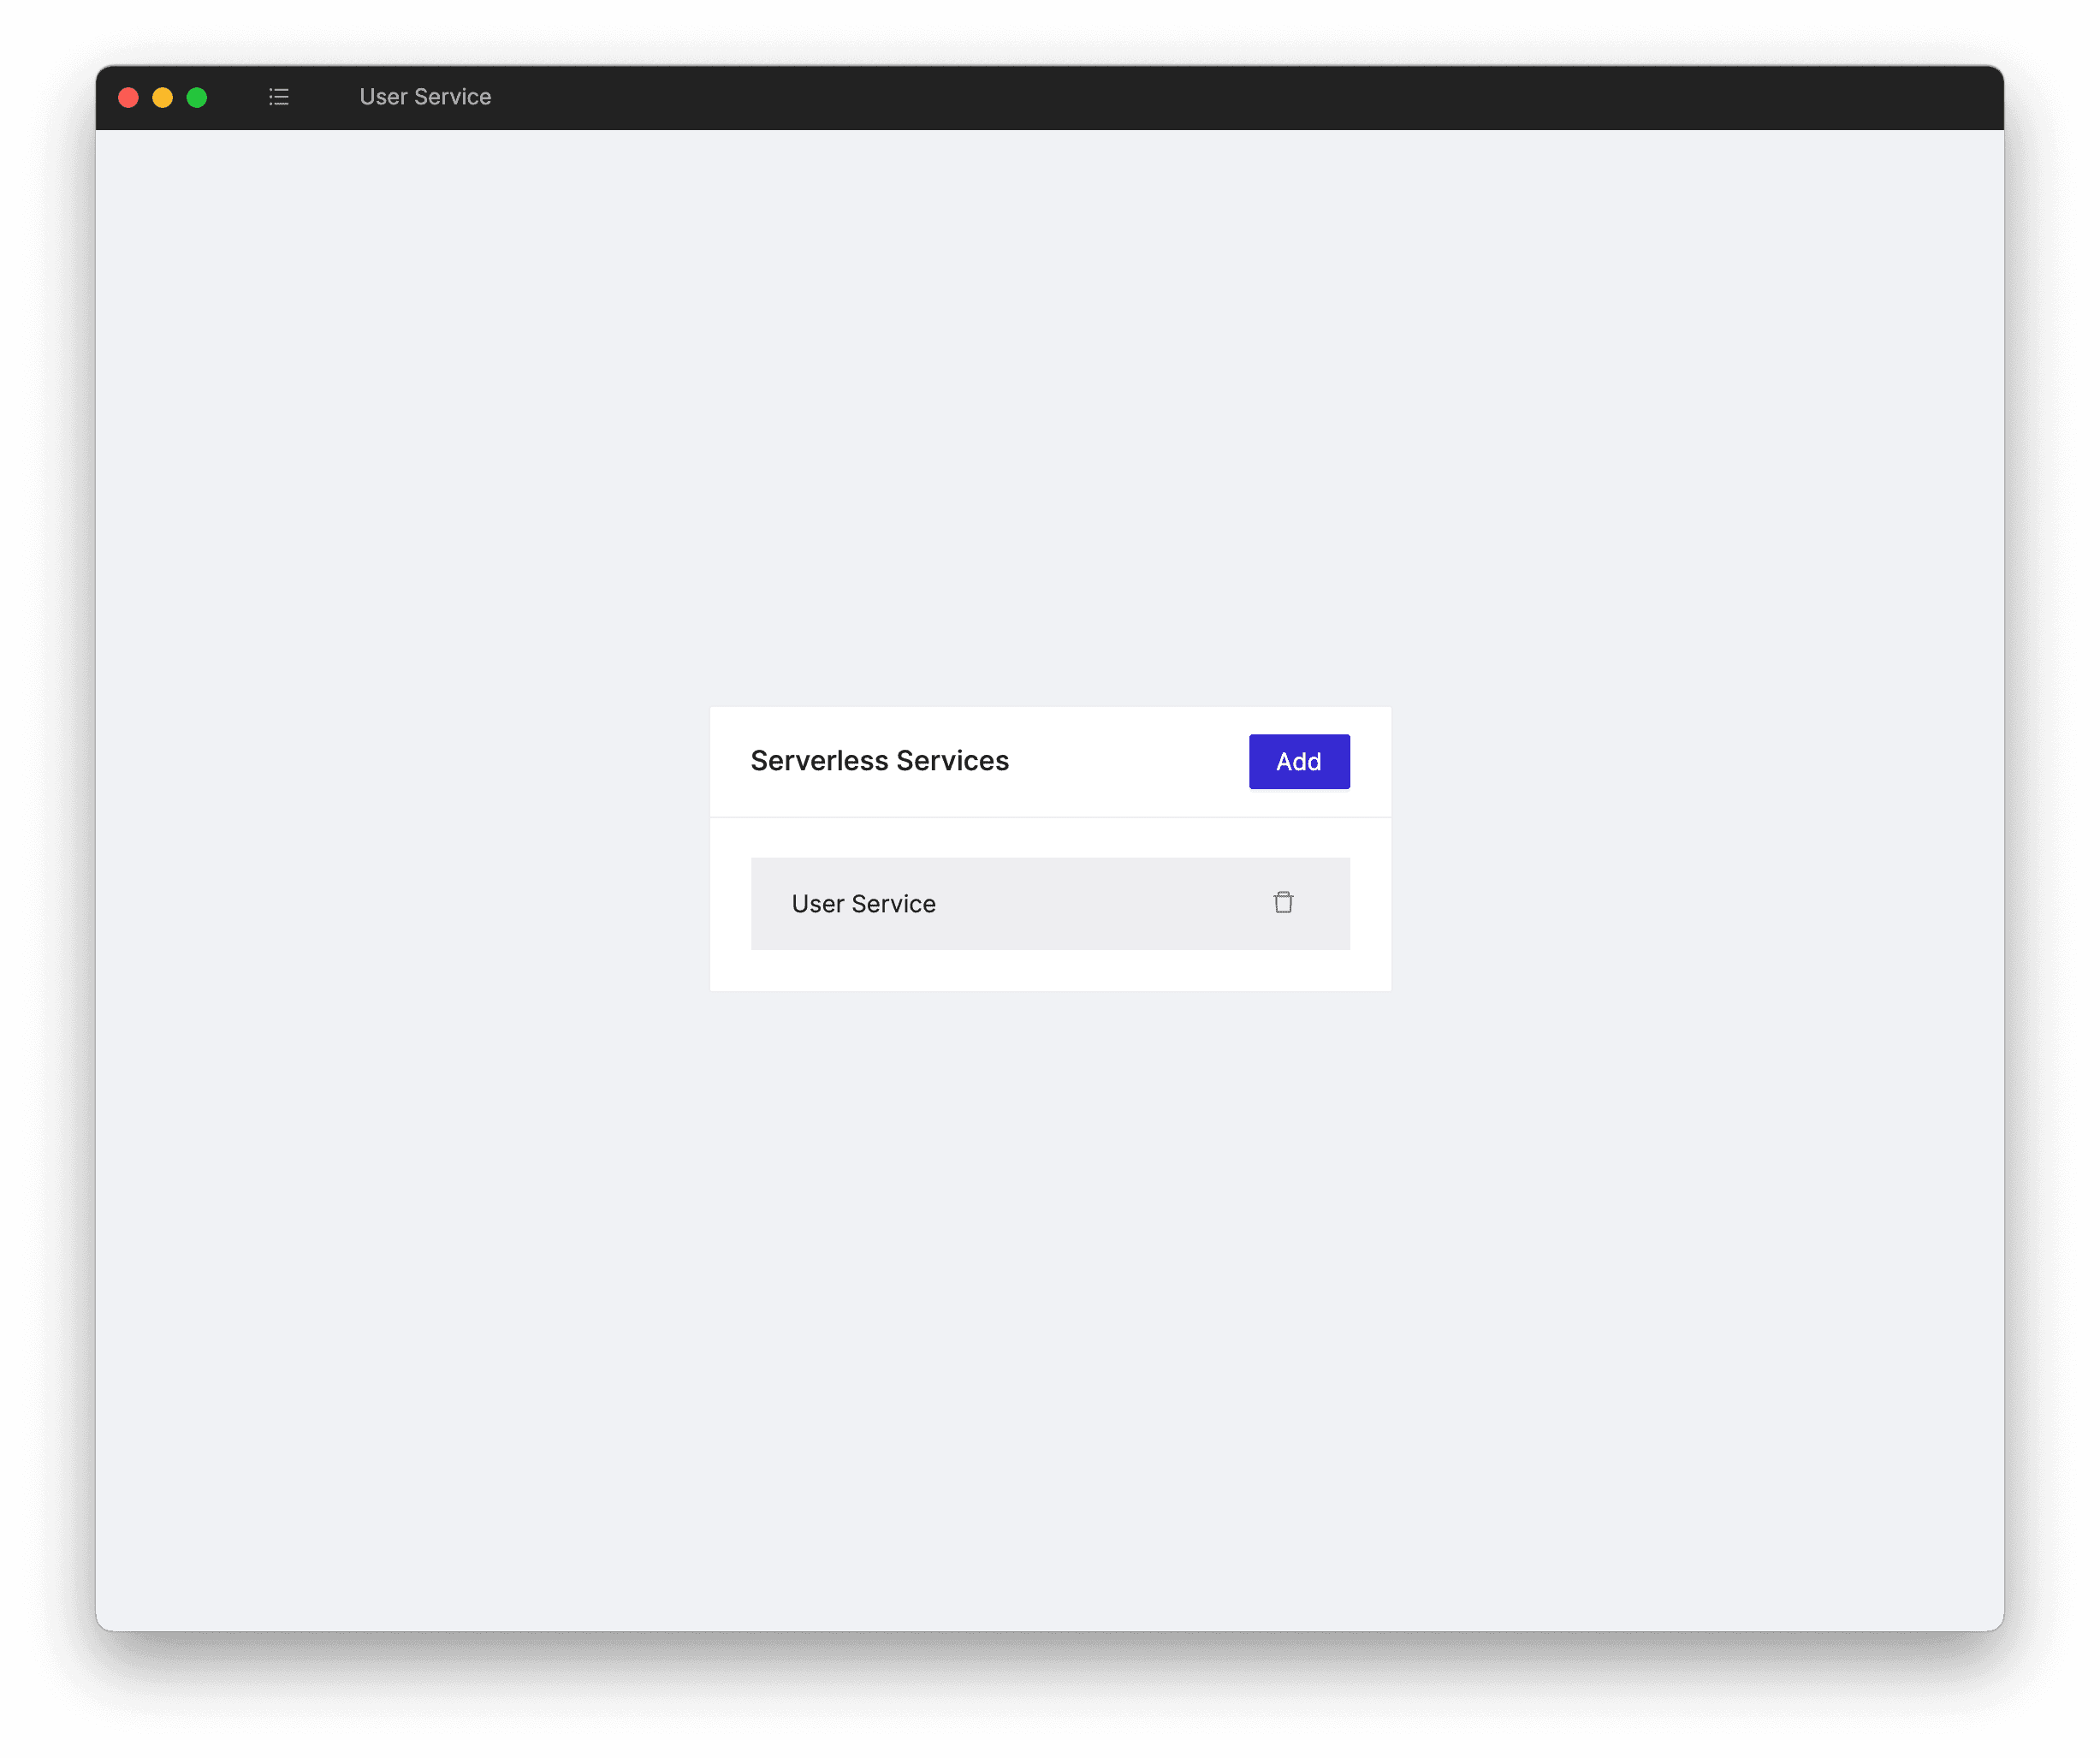
Nice! You've just added a serverless service to Cloudash, which took way less than an average CloudFormation deployment. Click on the service to navigate to an overview of all your resources.
Cloudash gives you a laser focused view into your serverless service - API Gateway metrics, requests, errors, latency, logs, Lambda functions and more. All in single place.
In the bottom left corner we see an Errors chart, and it seems that POST /users has some issues.
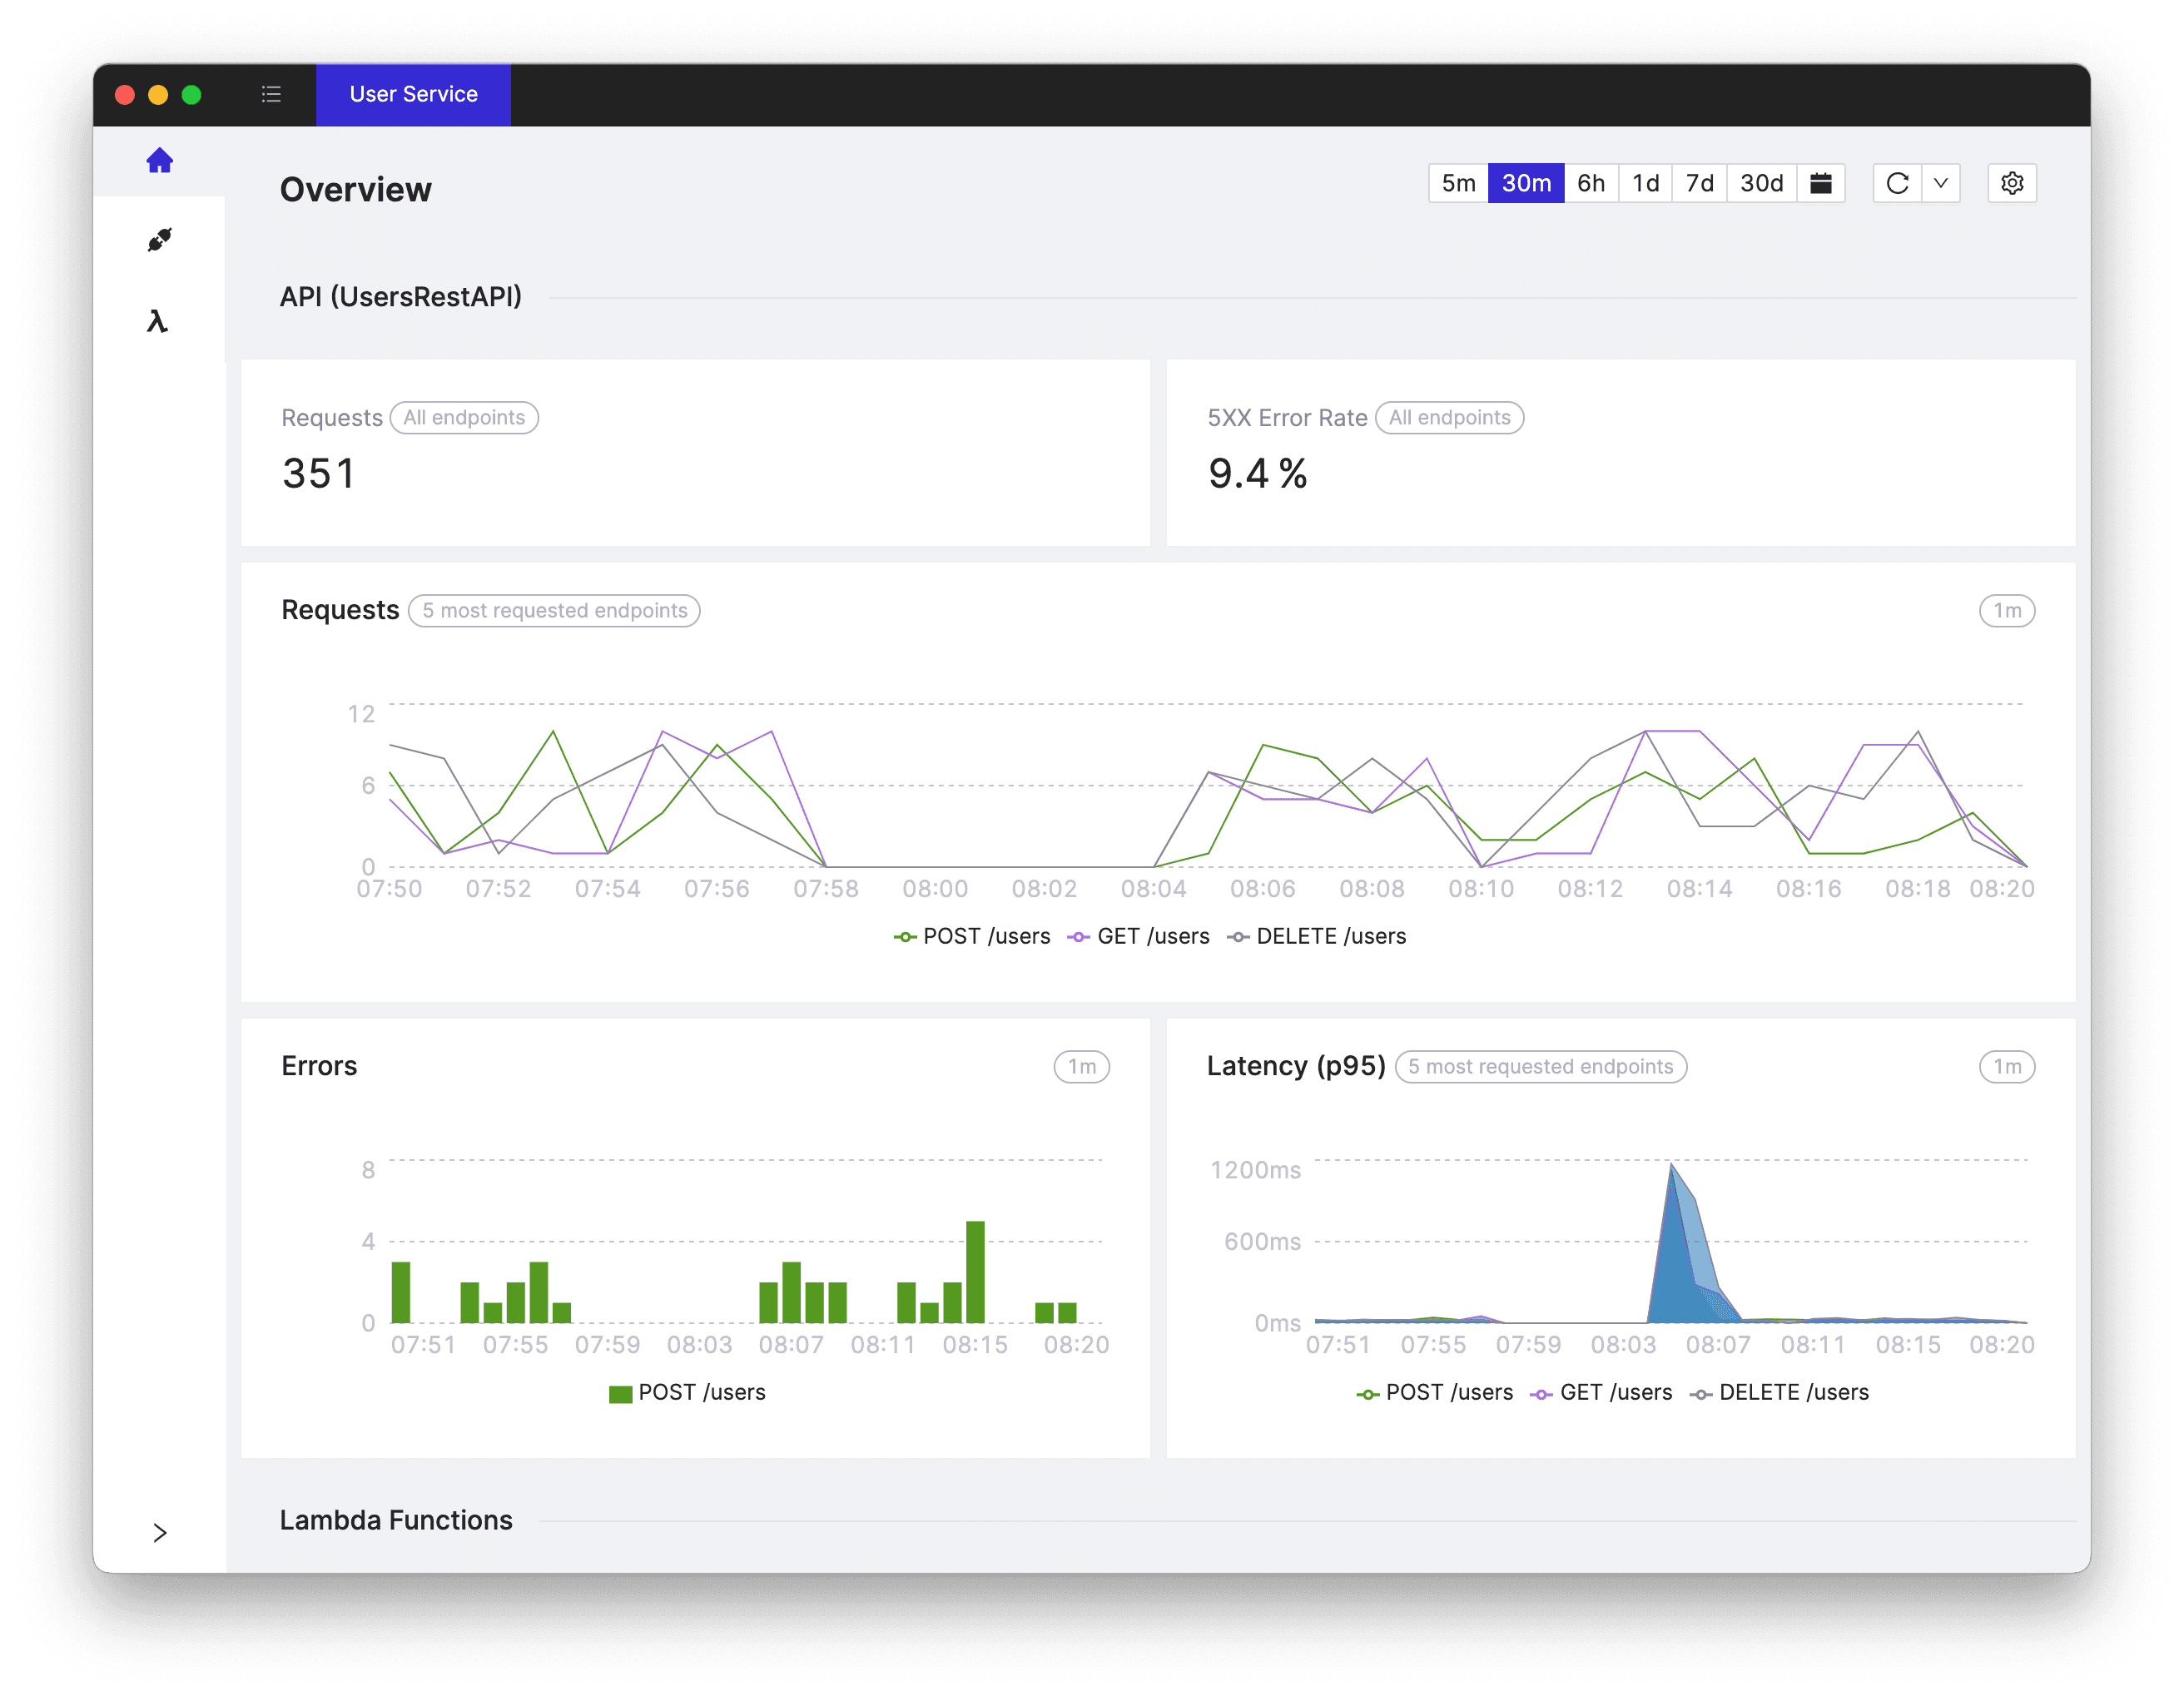
Let's scroll down to Lambda Functions overview.
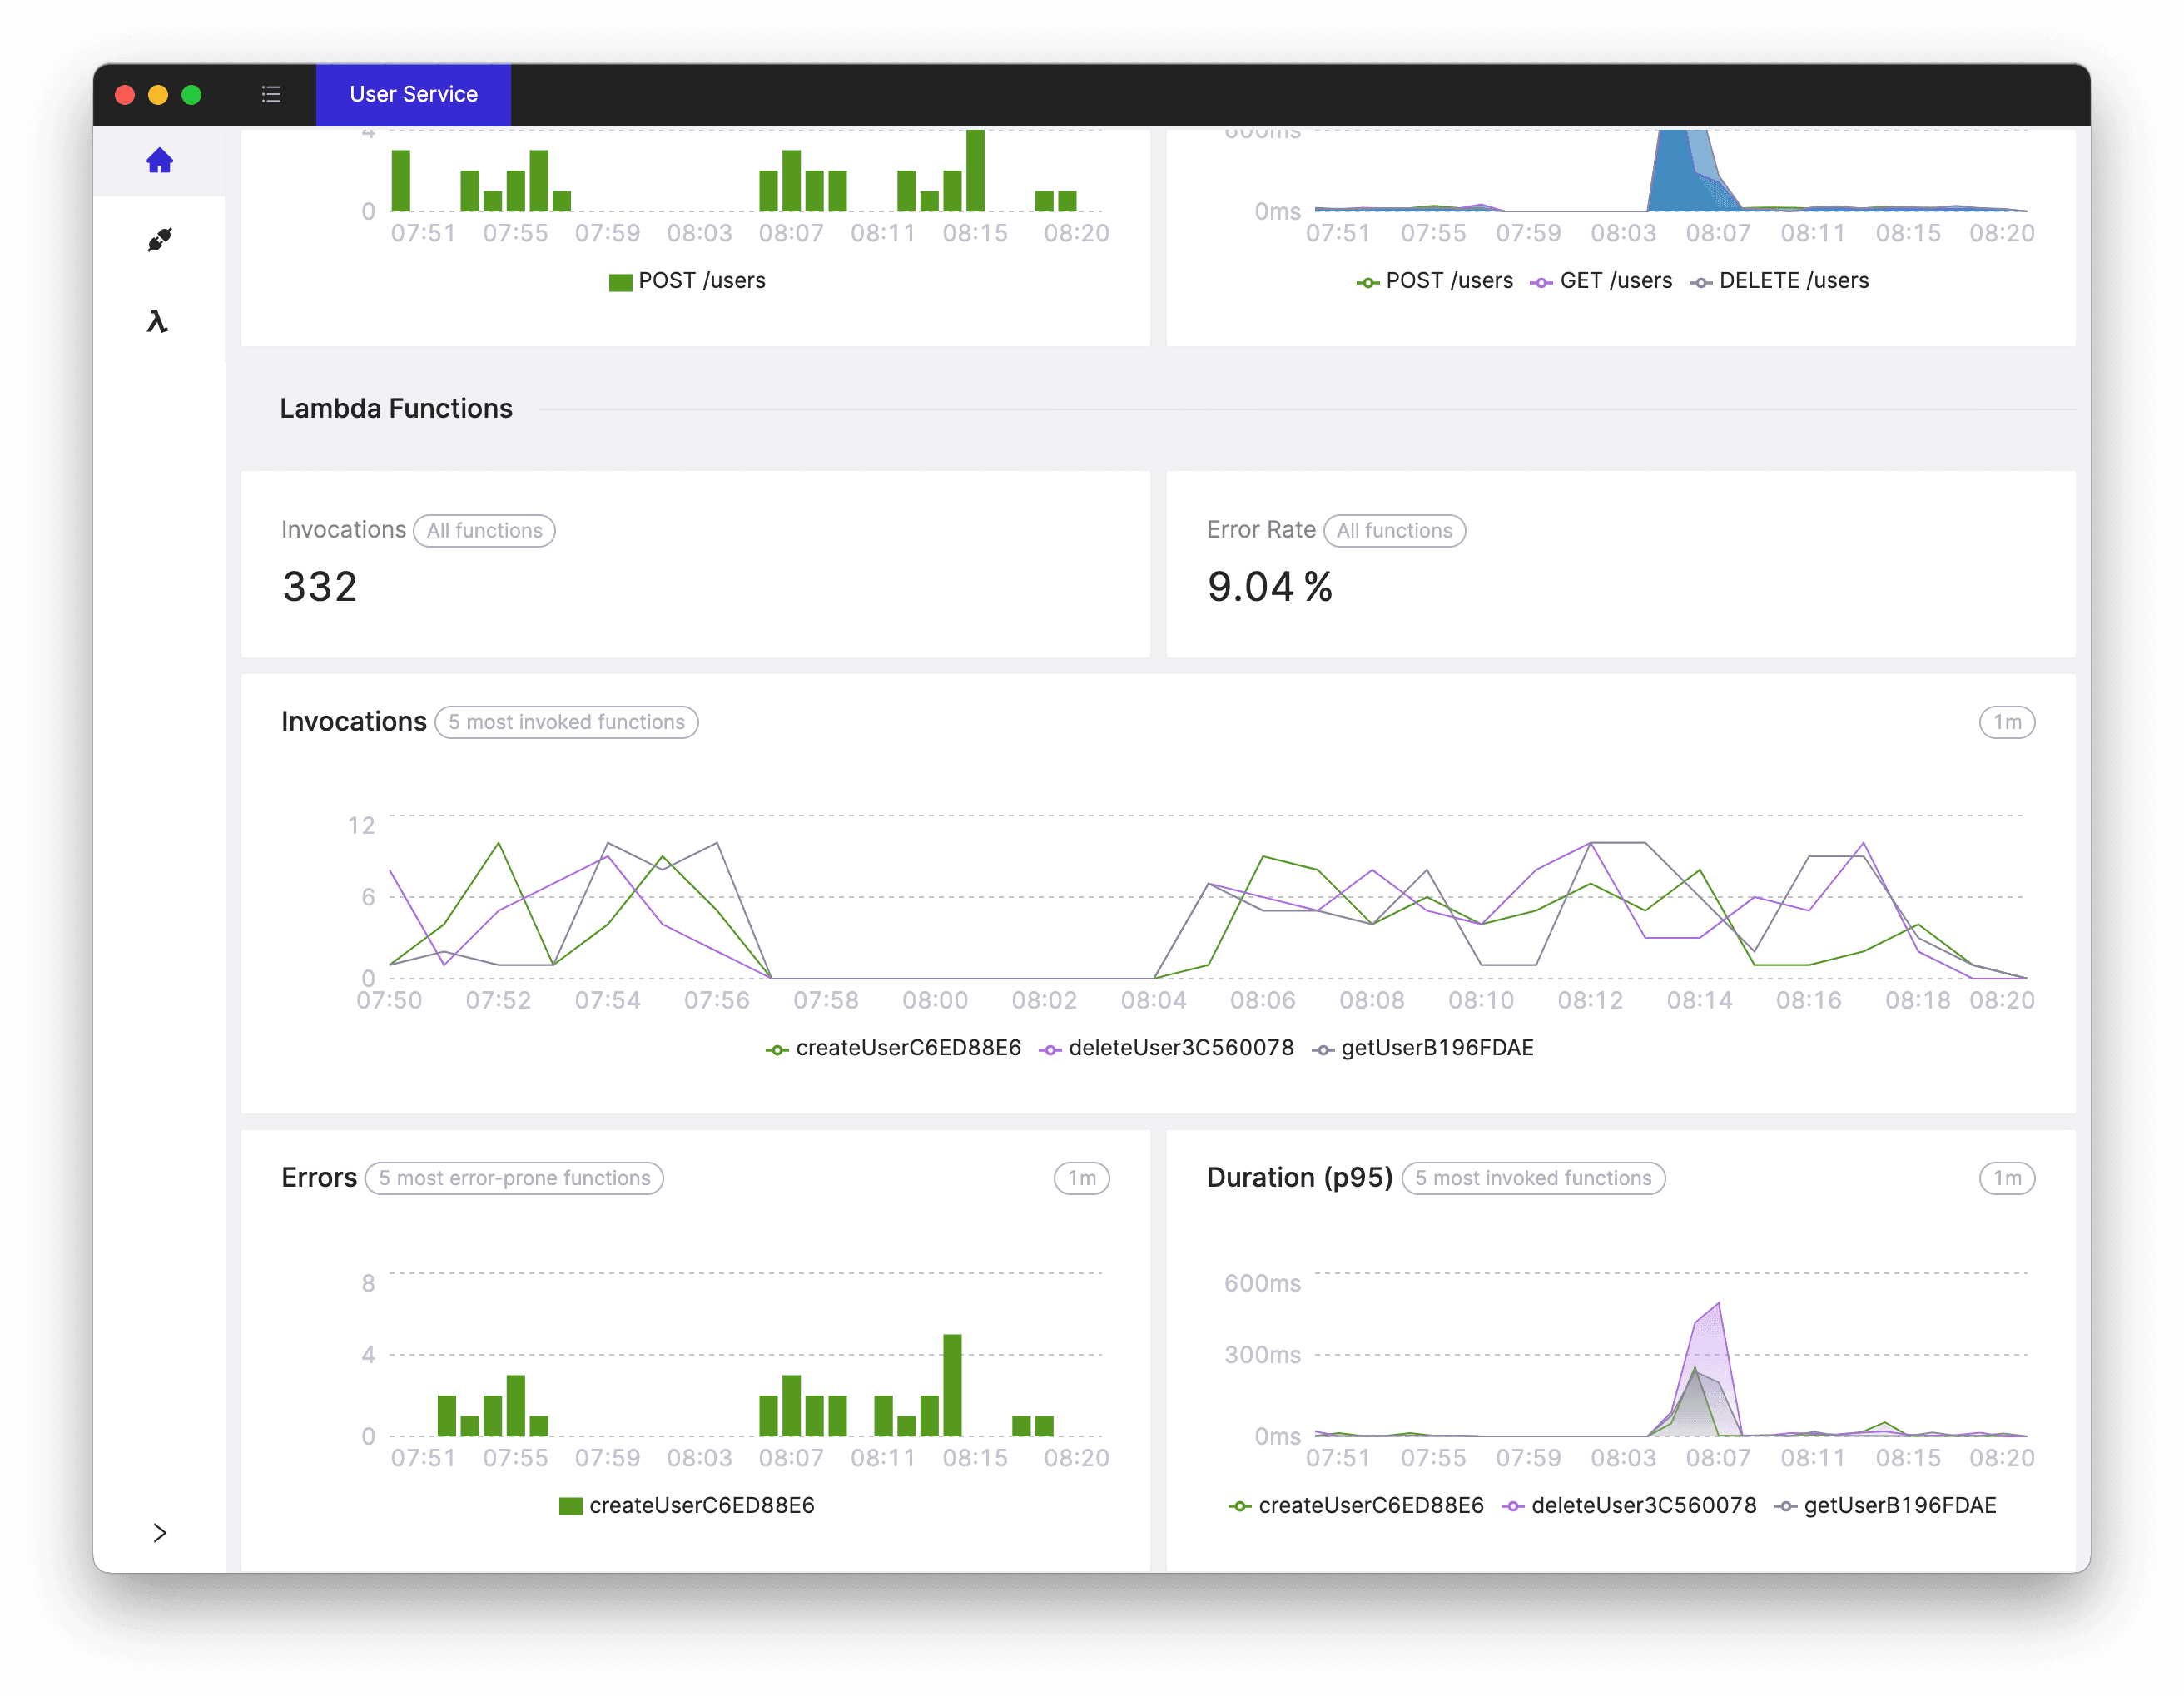
Whoops, looks like createUser function fails with an error most of the time. Let's dig in further
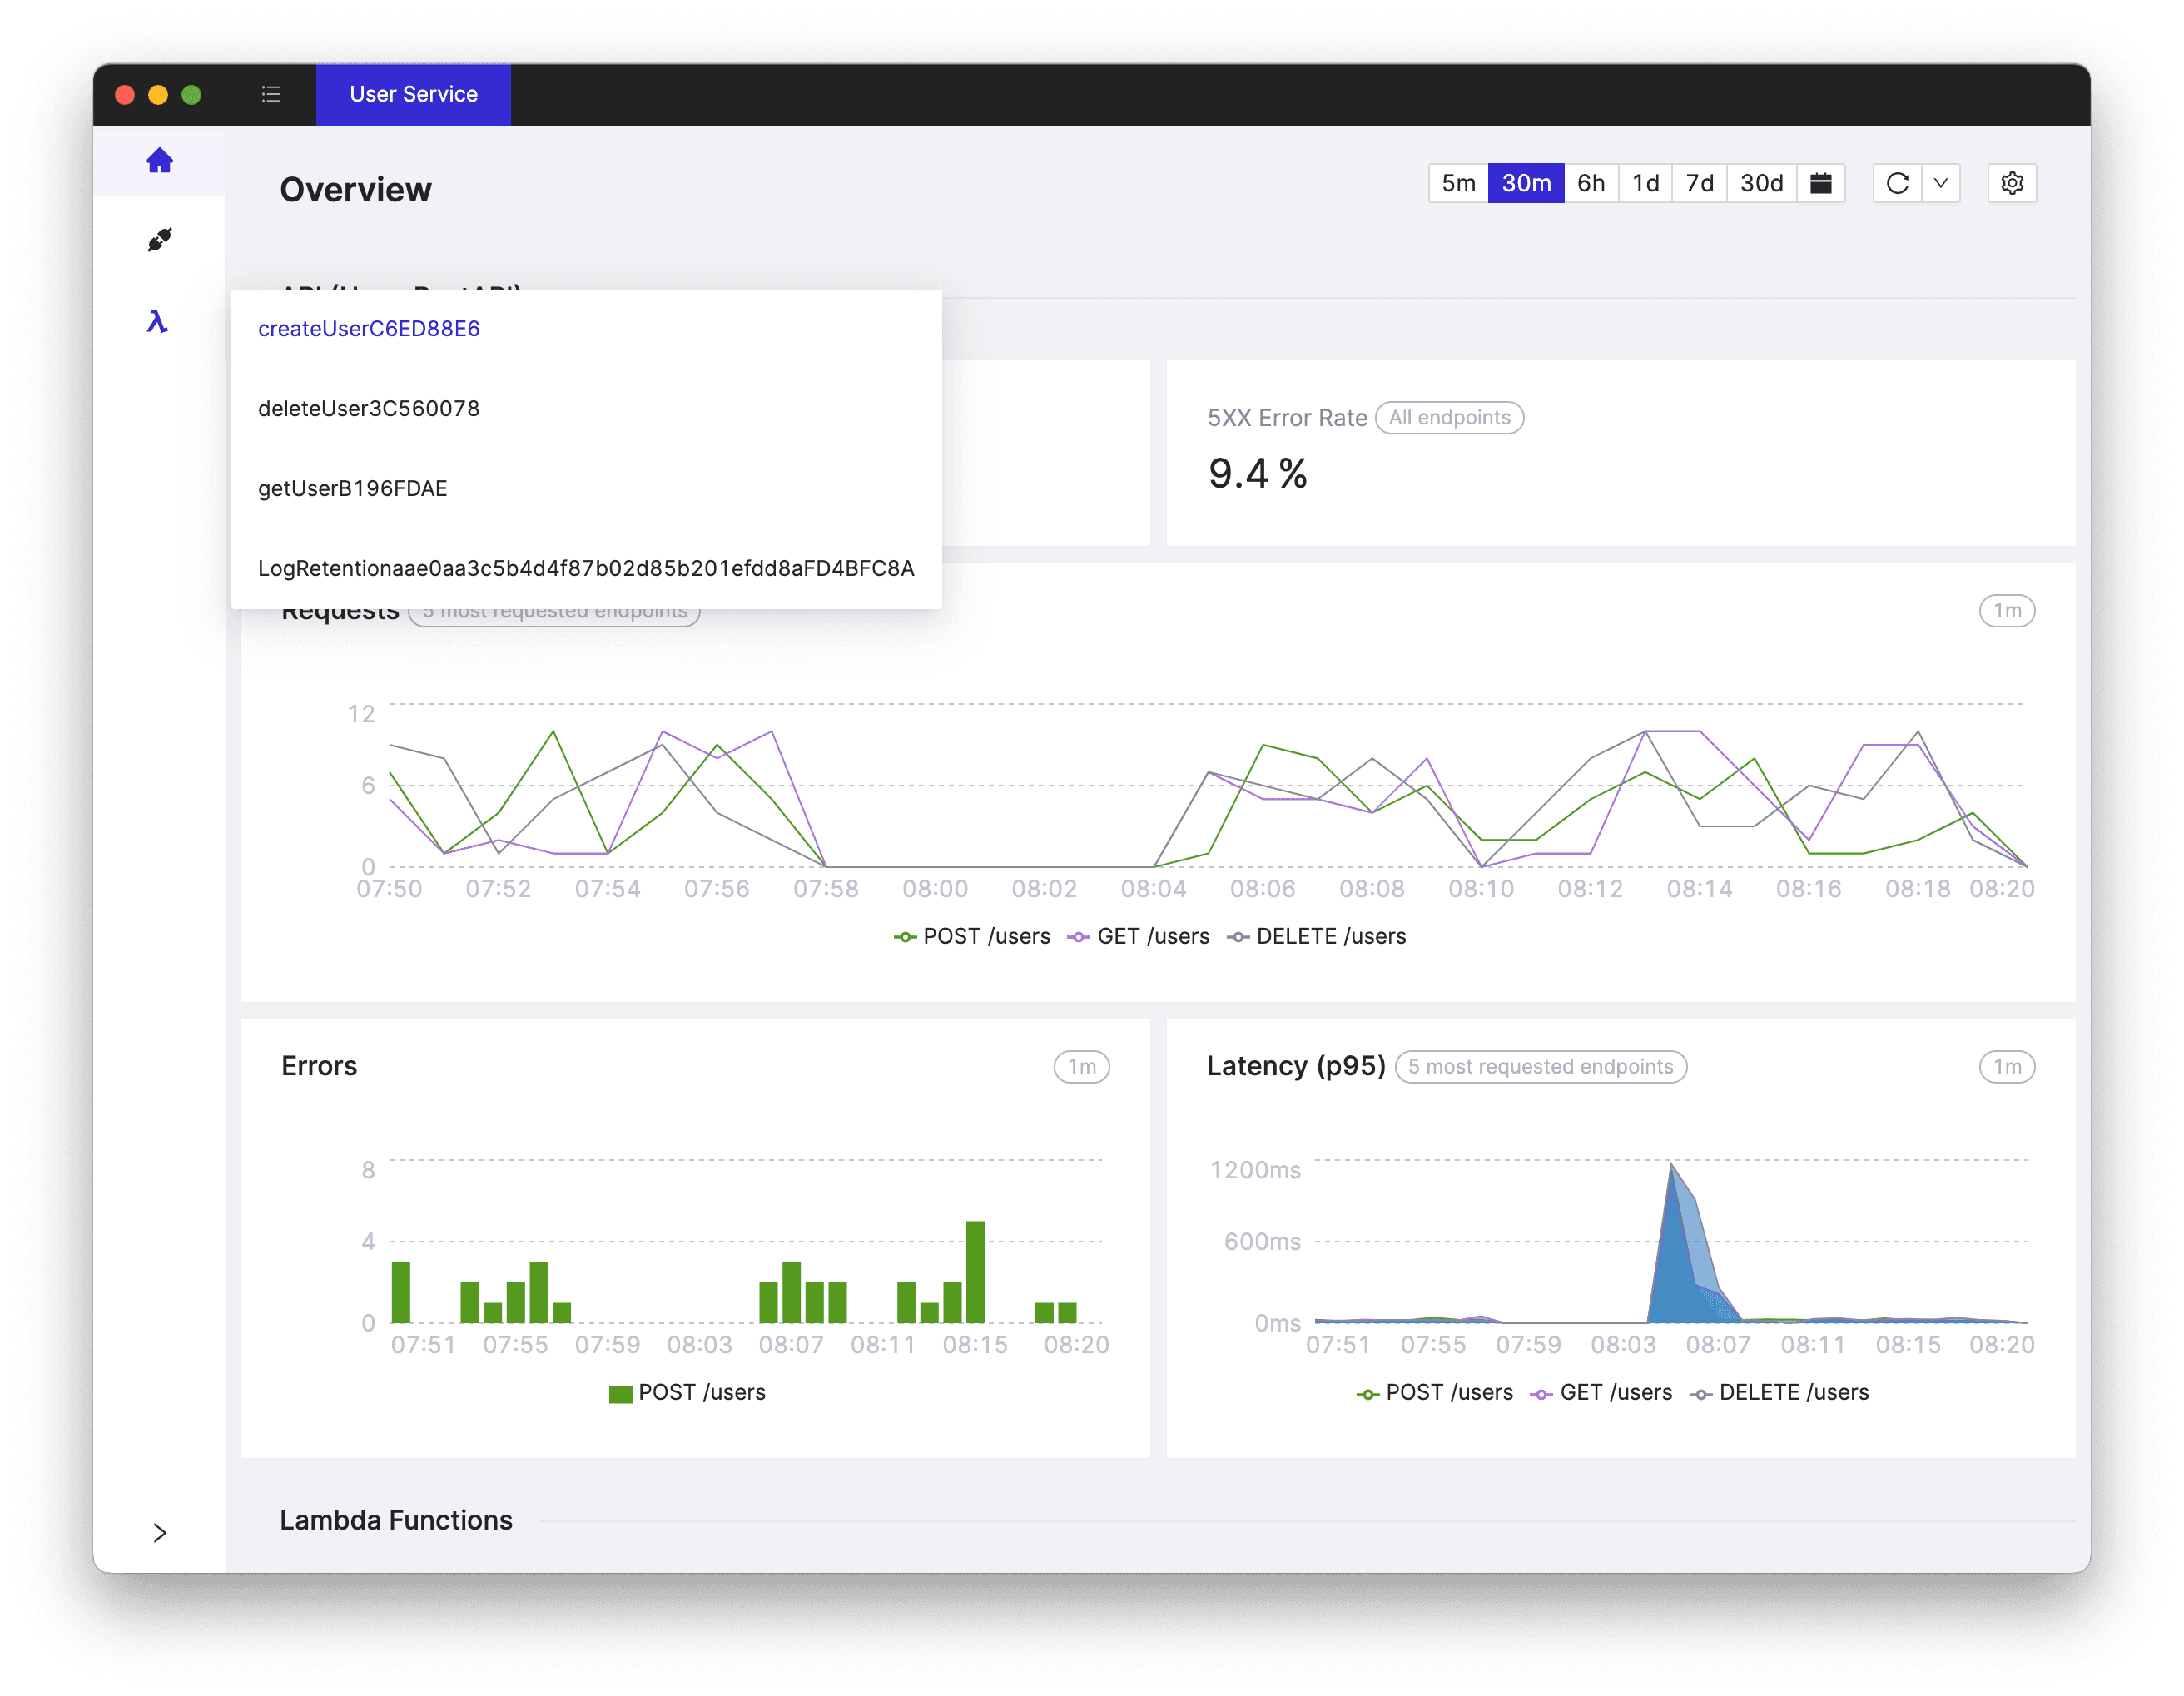
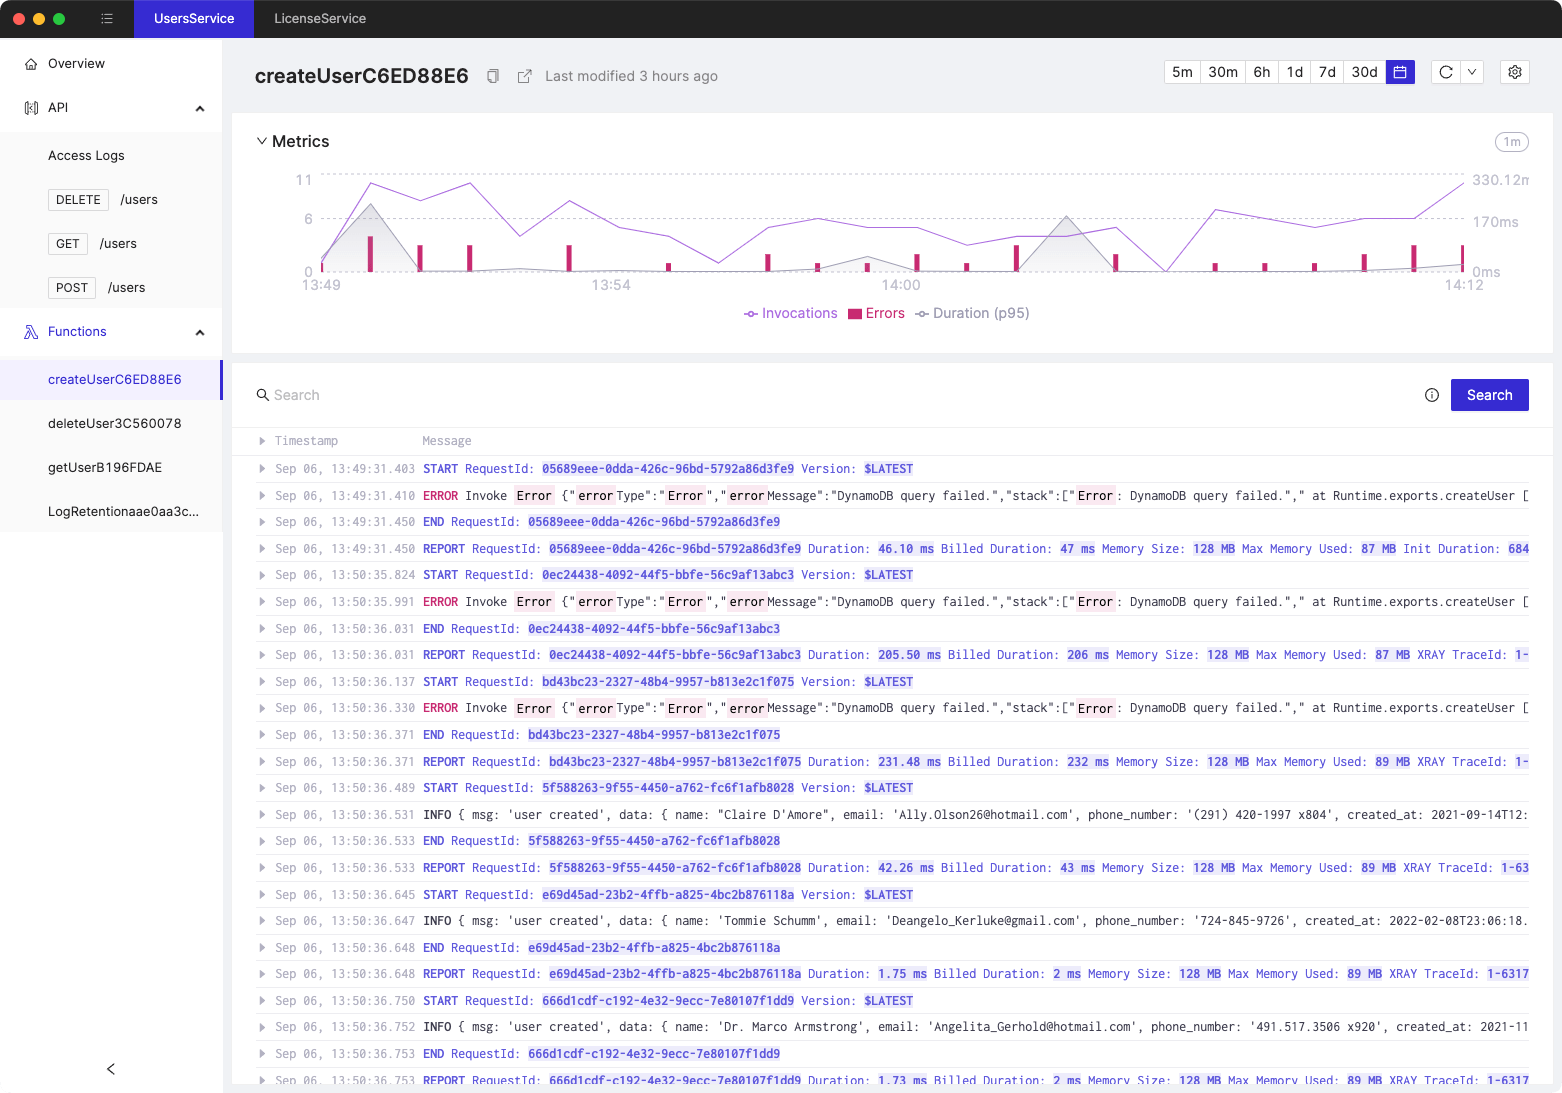
On the left side of the screen you can see a list of all resources - API Gateway APIs and Lambda functions. I'm going to select createUser function to dig in into its CloudWatch logs.
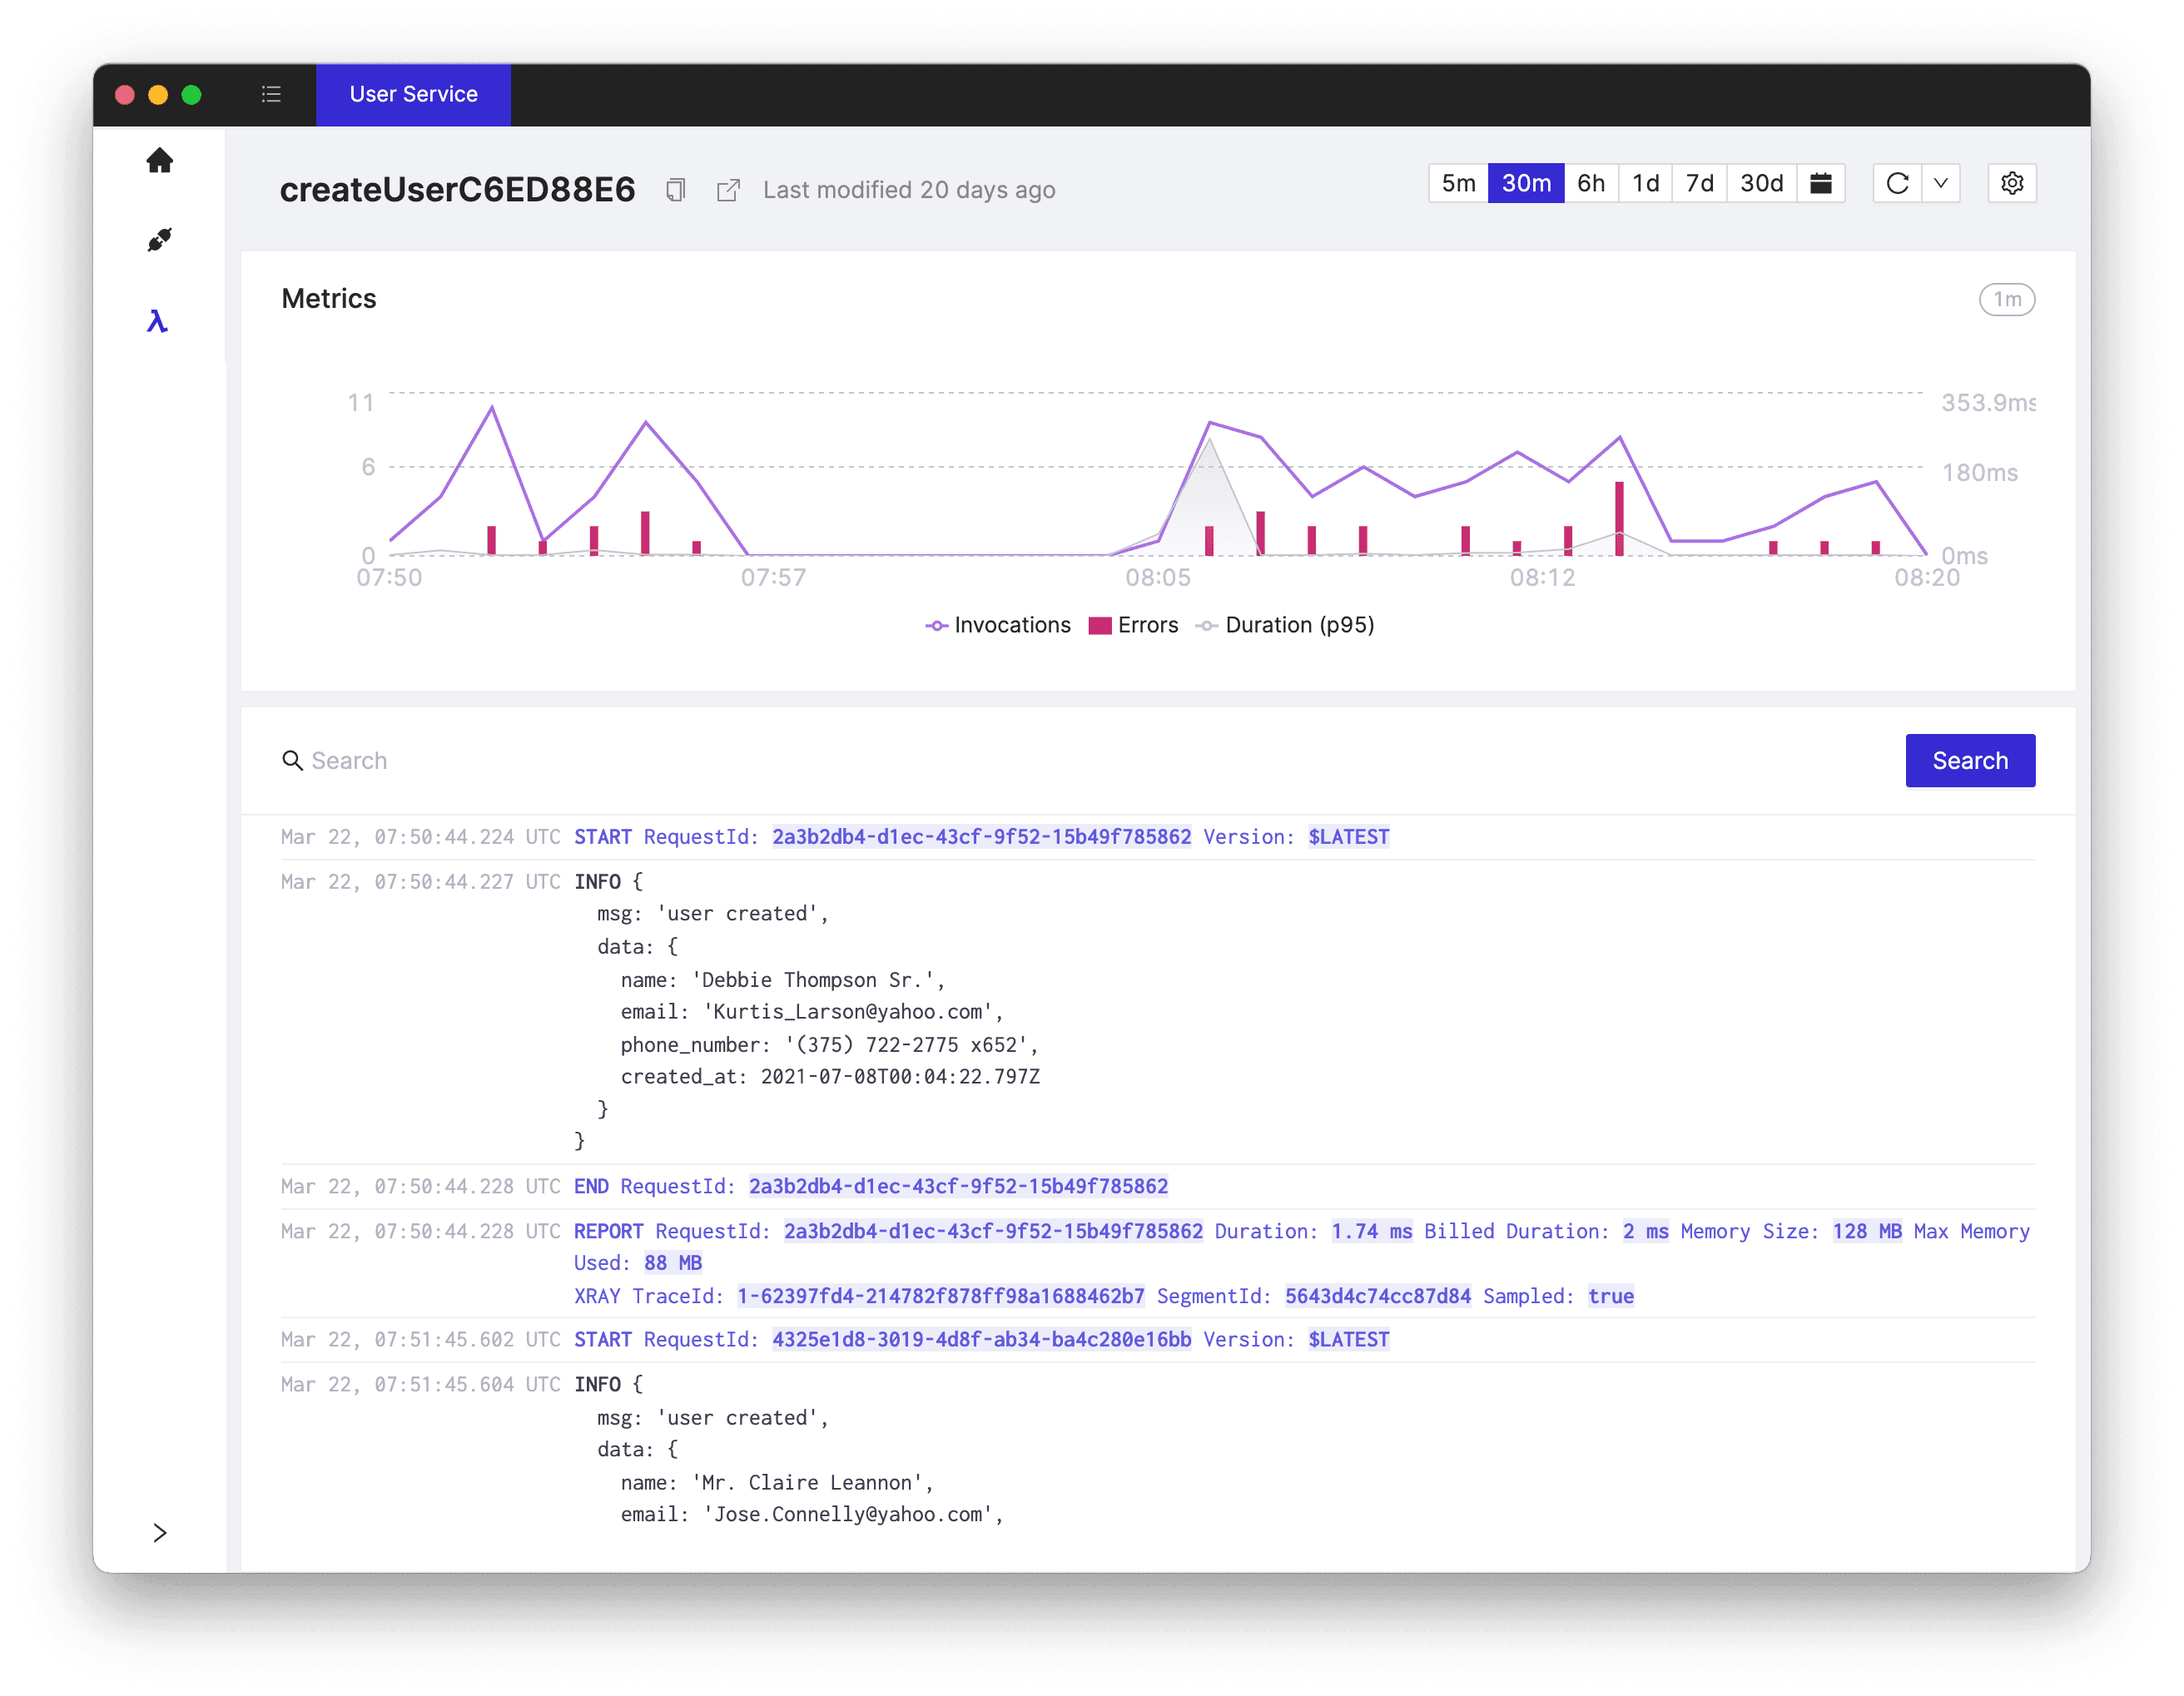
Welcome to the Cloudash Lambda view - you can see all the metrics and logs for this Lambda function, everything we need to investigate this issue in a single place. Judging by the graph it looks like around 7:50 UTC this Lambda function started experiencing issues. Let's select a time period from the chart to scope down the CloudWatch logs to a time period around one of the errors.
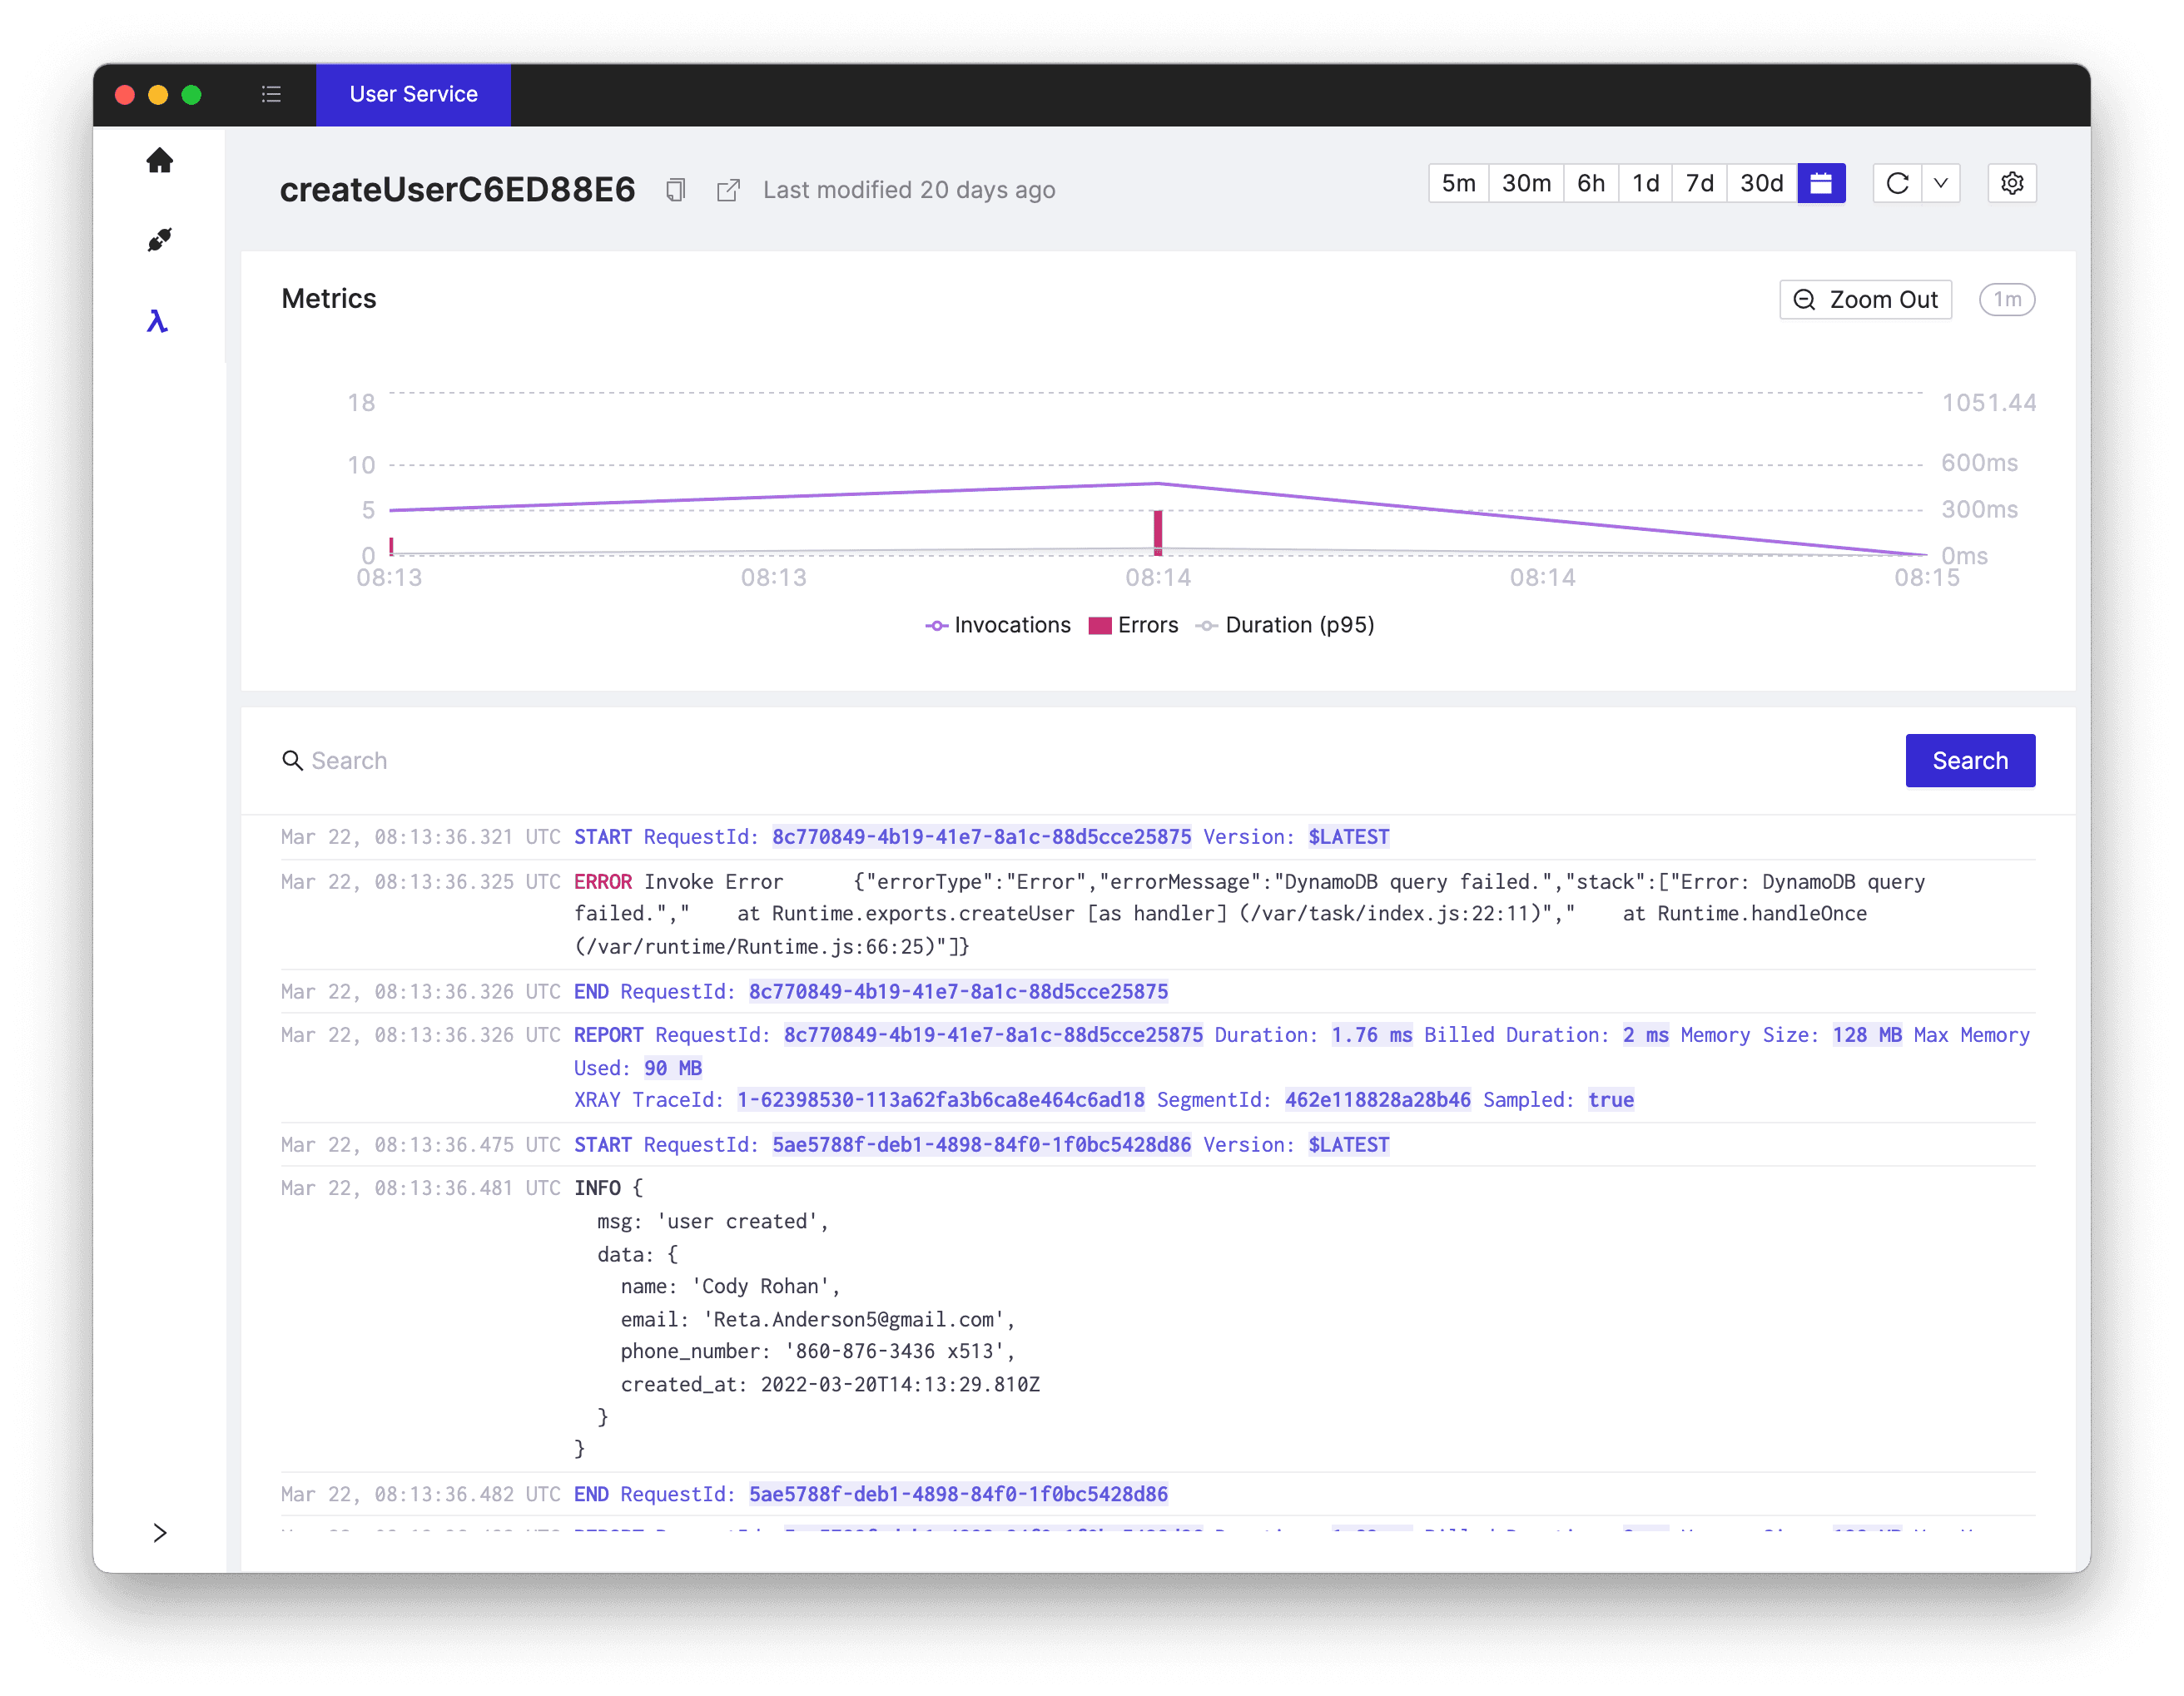
And here it is! The logs for this Lambda function are scoped down to a time period around the error that we're looking at. We can see the error right away, its message, and the stack trace.
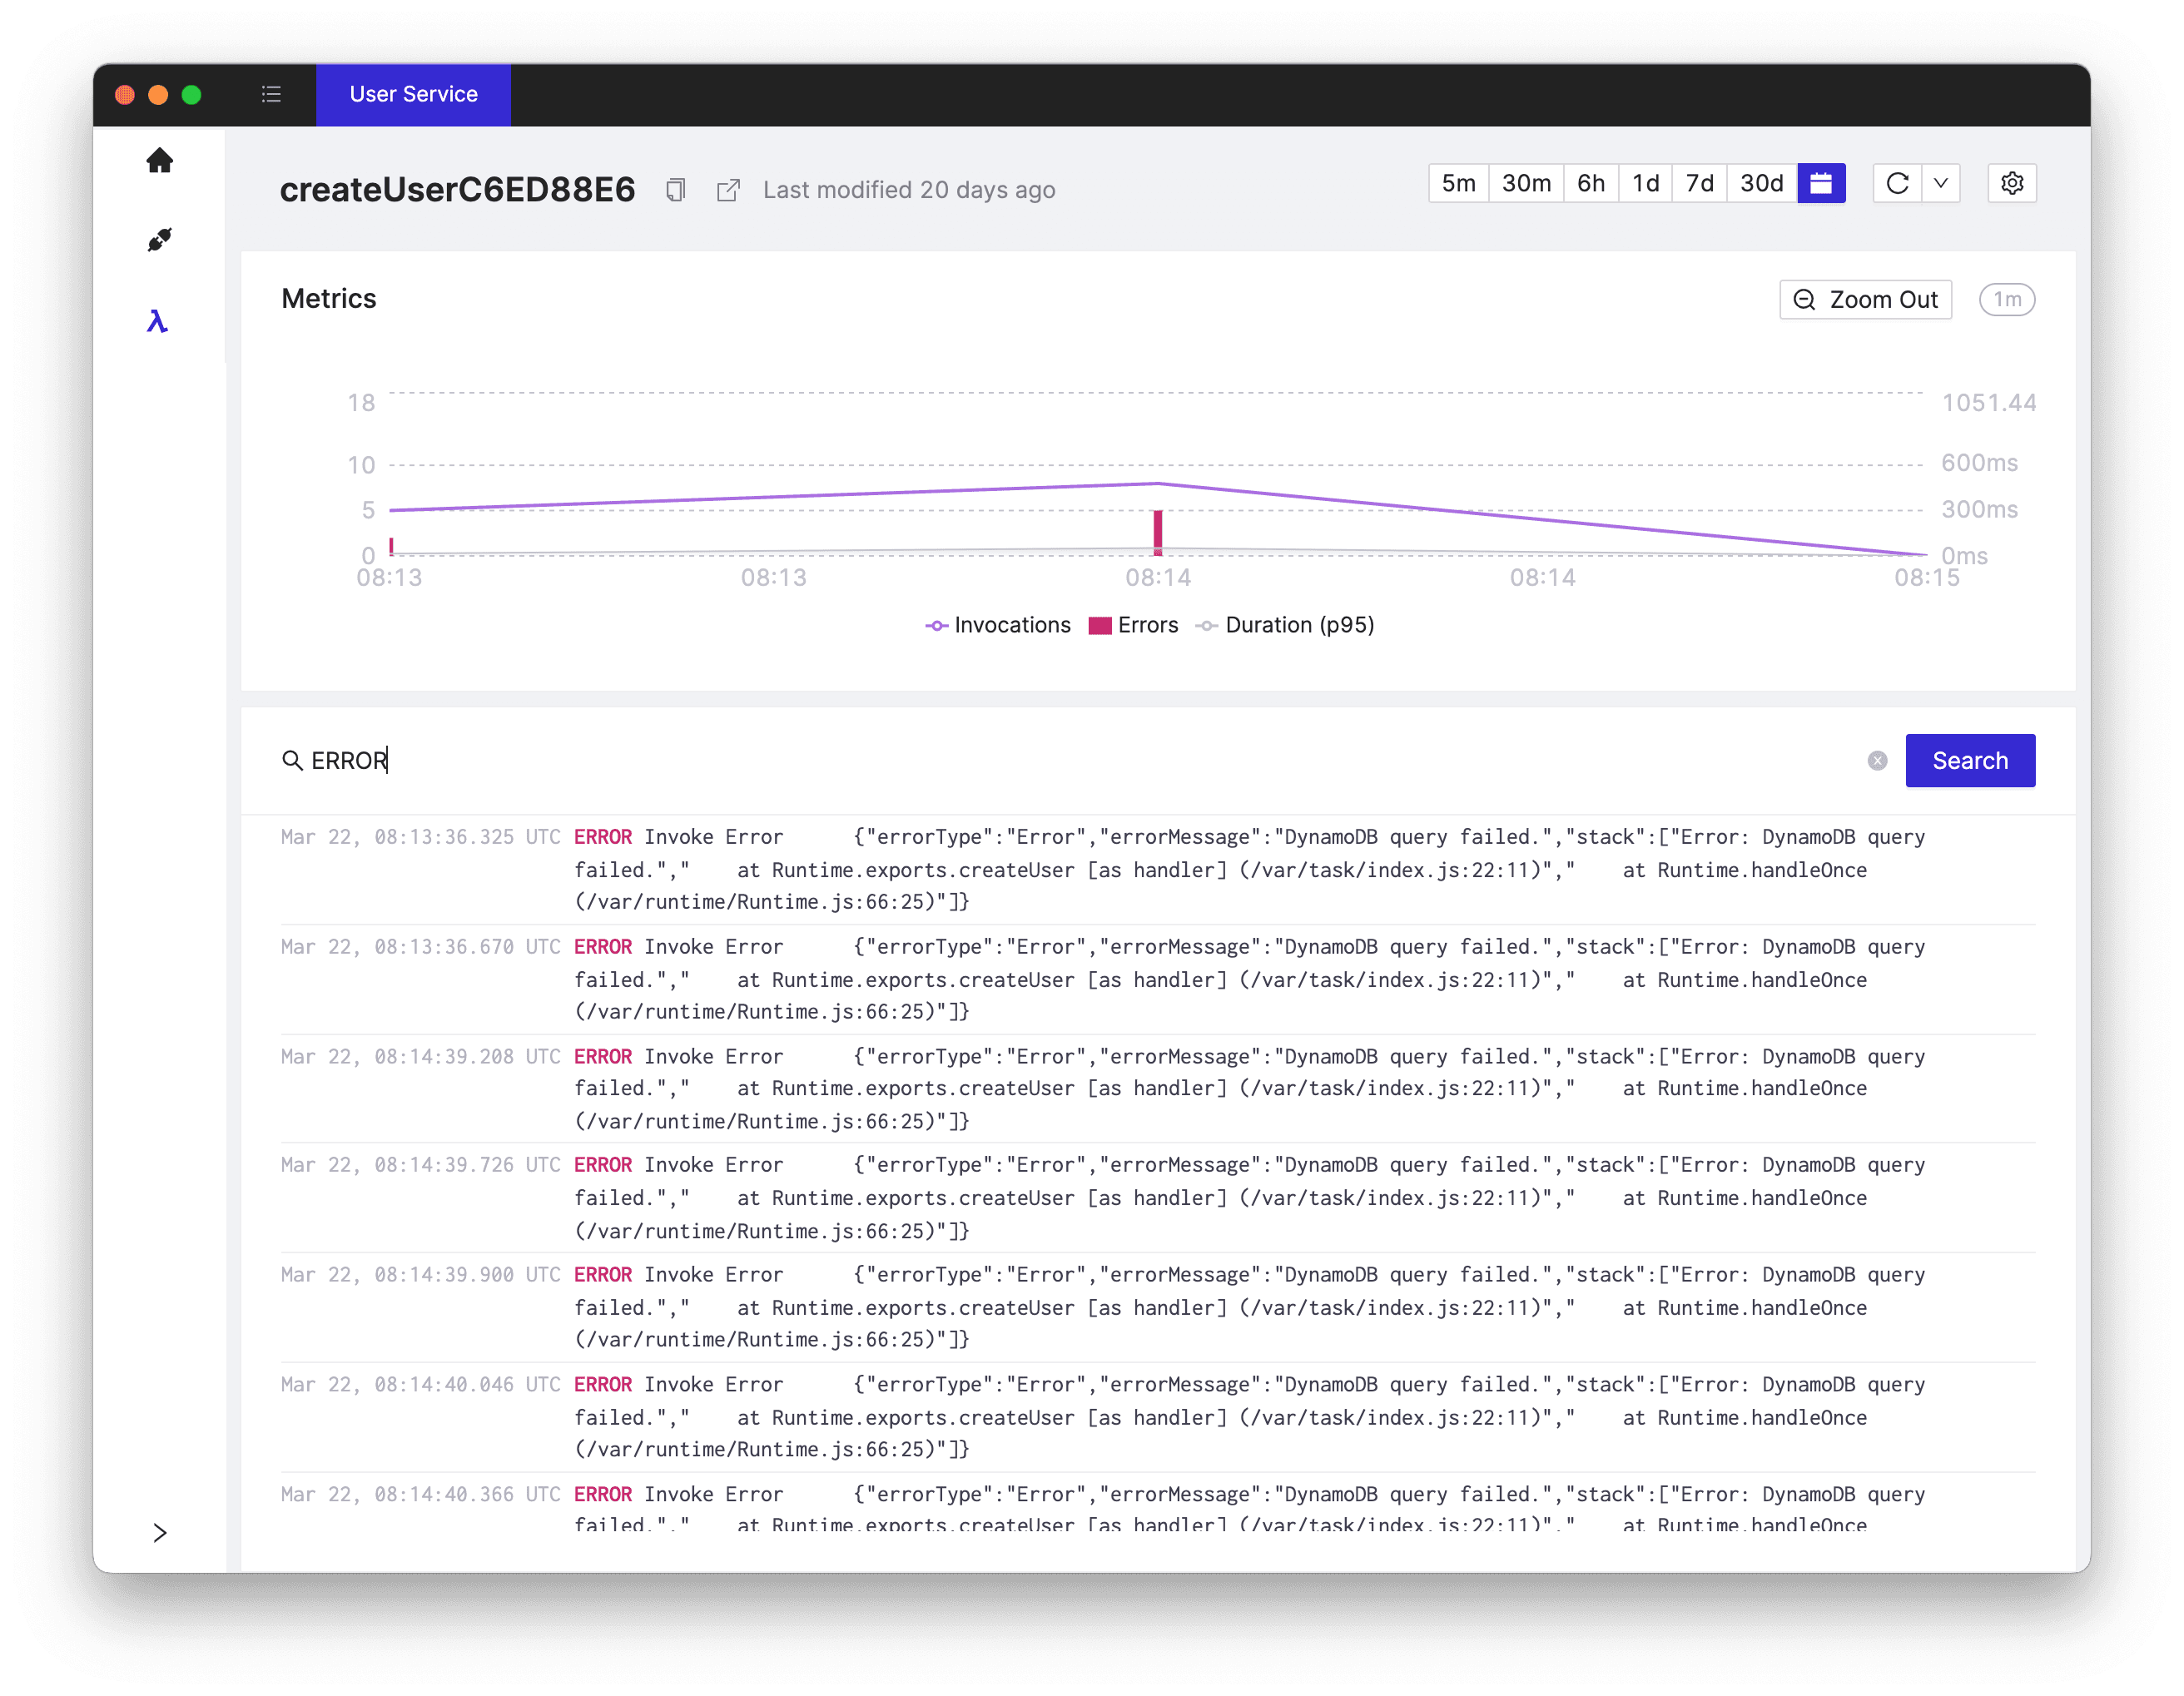
We can also search through all the logs for this Lambda function (since START/END/REPORT logs are not that crucial for us at the moment). It's clear that someone (definitely not me!) pushed a bug to the createUser function.
Note that we didn't need to open the AWS Console at all and the whole investigation took less than 5 minutes.
Cloudash - serverless monitoring. Simplified.
Tired of switching between AWS console tabs? 😒
Cloudash provides clear access to CloudWatch logs and metrics, to help you make quicker decisions.
Try it for free: