Intro to Analyzing Log Data with CloudWatch Logs Insights
- Authors

- Name
- Tomasz Łakomy
- @tlakomy
To quote AWS docs:
CloudWatch Logs Insights enables you to interactively search and analyze your log data in Amazon CloudWatch Logs. You can perform queries to help you more efficiently and effectively respond to operational issues. If an issue occurs, you can use CloudWatch Logs Insights to identify potential causes and validate deployed fixes.
- A single request can query up to 20 log groups
- Query results are available for 7 days
- Queries time out after 15 minutes
Supported Logs and Discovered Fields
For every log sent to CloudWatch Logs, five system fields are automatically generated:
@messagecontains the raw unparsed log event.@timestampcontains the event timestamp contained in the log event's timestamp field.@ingestionTimecontains the time when the log event was received by CloudWatch Logs.@logStreamcontains the name of the log stream that the log event was added to. Log streams are used to group logs by the same process that generated them.@logis a log group identifier in the form of account-id:log-group-name. This can be useful in queries of multiple log groups, to identify which log group a particular event belongs to.
For every log type (e.g. Lambda logs) CloudWatch Logs Insights discovers additional log fields, example for Lambda:
@timestamp, @logStream, @message, @requestId, @duration, @billedDuration, @type, @maxMemoryUsed, @memorySize
and additional X-Ray fields (where applicable)
- It's possible to limit the number of results using
limitcommand (headandtailare also available but they're getting deprecated in favour oflimit) SHIFT + ENTERruns a query- We can use
filtercommand to, well, filter the results (make sure to use|operator between commands), example:
filter event.body.name="hello_world"
| fields @timestamp, @message, event.body.name
| limit 20
- We can use
statscommand to run an aggregation query, e.g. finding a number of log events in the log group that were received by CloudWatch Logs that contain each different value for the field name of our choosing:
stats count(*) by event.body.name
Show the number of log events in the log group that were received by CloudWatch Logs for each 30-second period.
stats count(*) by bin(30s)
The following query filters only the log messages containing Received response:
fields @timestamp, @message
| filter @message like 'Received response.'
| sort @timestamp desc
More sample queries: https://marbot.io/blog/analyze-cloudwatch-logs-like-a-pro.html
Commands
(adapted from here)
display- Defines the fields to display in a query. You should only use this command once per query since only the last display command is applied.fields- Lists the available fields for display from a log. You can also use this command, along with supported operations or functions to create new fields for the query or modify field values.filter- Enables you to filter your query according to defined conditions.stats- Aggregates statistics of your field values. With this command you can specify groups of values to aggregate by.sort- Enables you to sort your returned values in either descending or ascending order.limit- Enables you to restrict how many values are returned by your query.parse- Enables you to extract data from queried fields for additional queries. This command works with regular and glob expressions.
parse command:
Using this single log line as an example:
25 May 2019 10:24:39,474 [ERROR] {foo=2, bar=data} The error was: DataIntegrityException
The following two parse expressions each do the following: the ephemeral fields level, config, and exception are created. level has a value of ERROR, config has a value of {foo=2, bar=data}, and exception has a value of DataIntegrityException. The first example uses a glob expression, and the second uses a regular expression.
-
parse @message "[*] * The error was: *" as level, config, exception -
parse @message /\[(?<level>\S+)\]\s+(?<config>\{.*\})\s+The error was: (?<exception>\S+)/
The difference between fields and display
From the docs:
Both
fieldsanddisplayare used to specify the fields to display in the query results. The differences between the two are as follows:
- You use the
displaycommand only to specify which fields to display in the results. You can use thefieldscommand with the as keyword to create new ephemeral fields using functions and the fields that are in the log event. For example,fields ispresent(resolverArn) as isRescreates an ephemeral field namedisReswhich can be used in the remainder of the query. The value ofisResis either 0 or 1 depending on whether or notresolverArnis a discovered field in the log event.- If you have multiple
fieldscommands and do not include adisplaycommand, the fields specified in all of thefieldscommands are displayed.
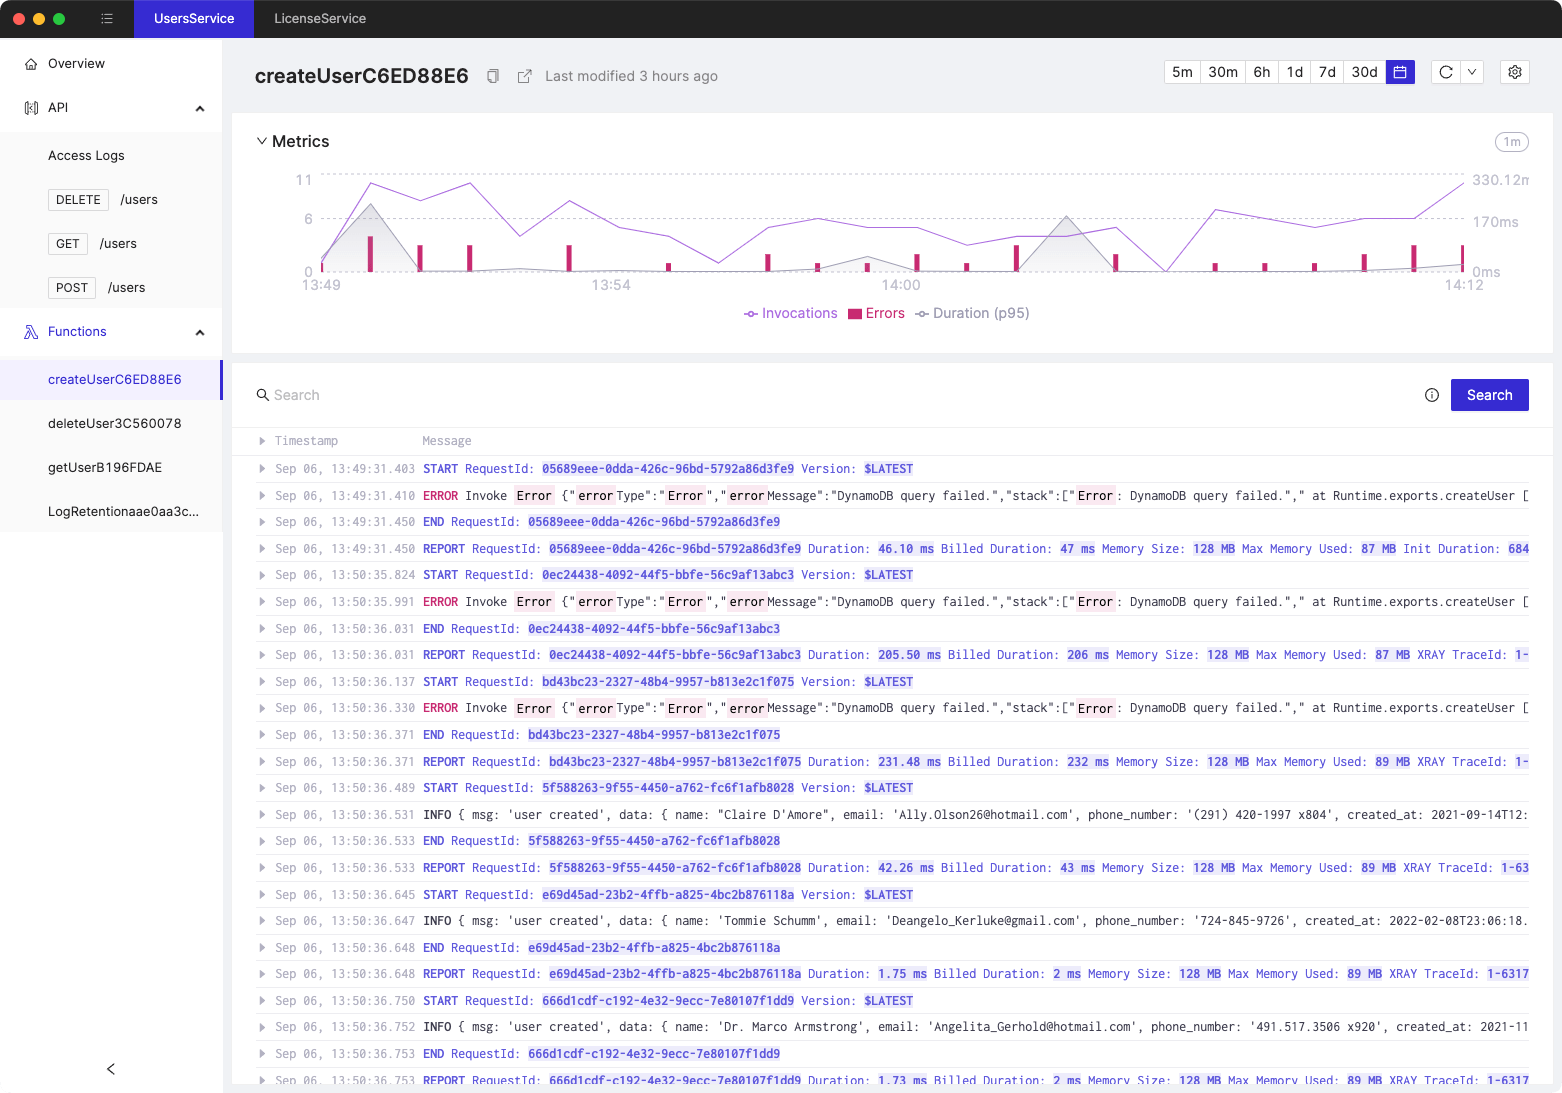
Tired of switching between AWS console tabs? 😒
Cloudash provides clear access to CloudWatch logs and metrics, to help you make quicker decisions.
Try it for free: