Two lesser-known ways to increase observability in AWS Lambda based applications
- Authors

- Name
- Wojciech Matuszewski
- @wm_matuszewski
If you have ever worked in a microservices environment, you probably are aware of how vital monitoring and observability are. Every outage can turn into a "murder mystery", where developers spend a significant amount of time uncovering what exactly went wrong and how it could have been prevented.
This blog post aims to show you two lesser-known techniques you can employ to turn an AWS Lambda related "murder mystery" into a simple logs check.
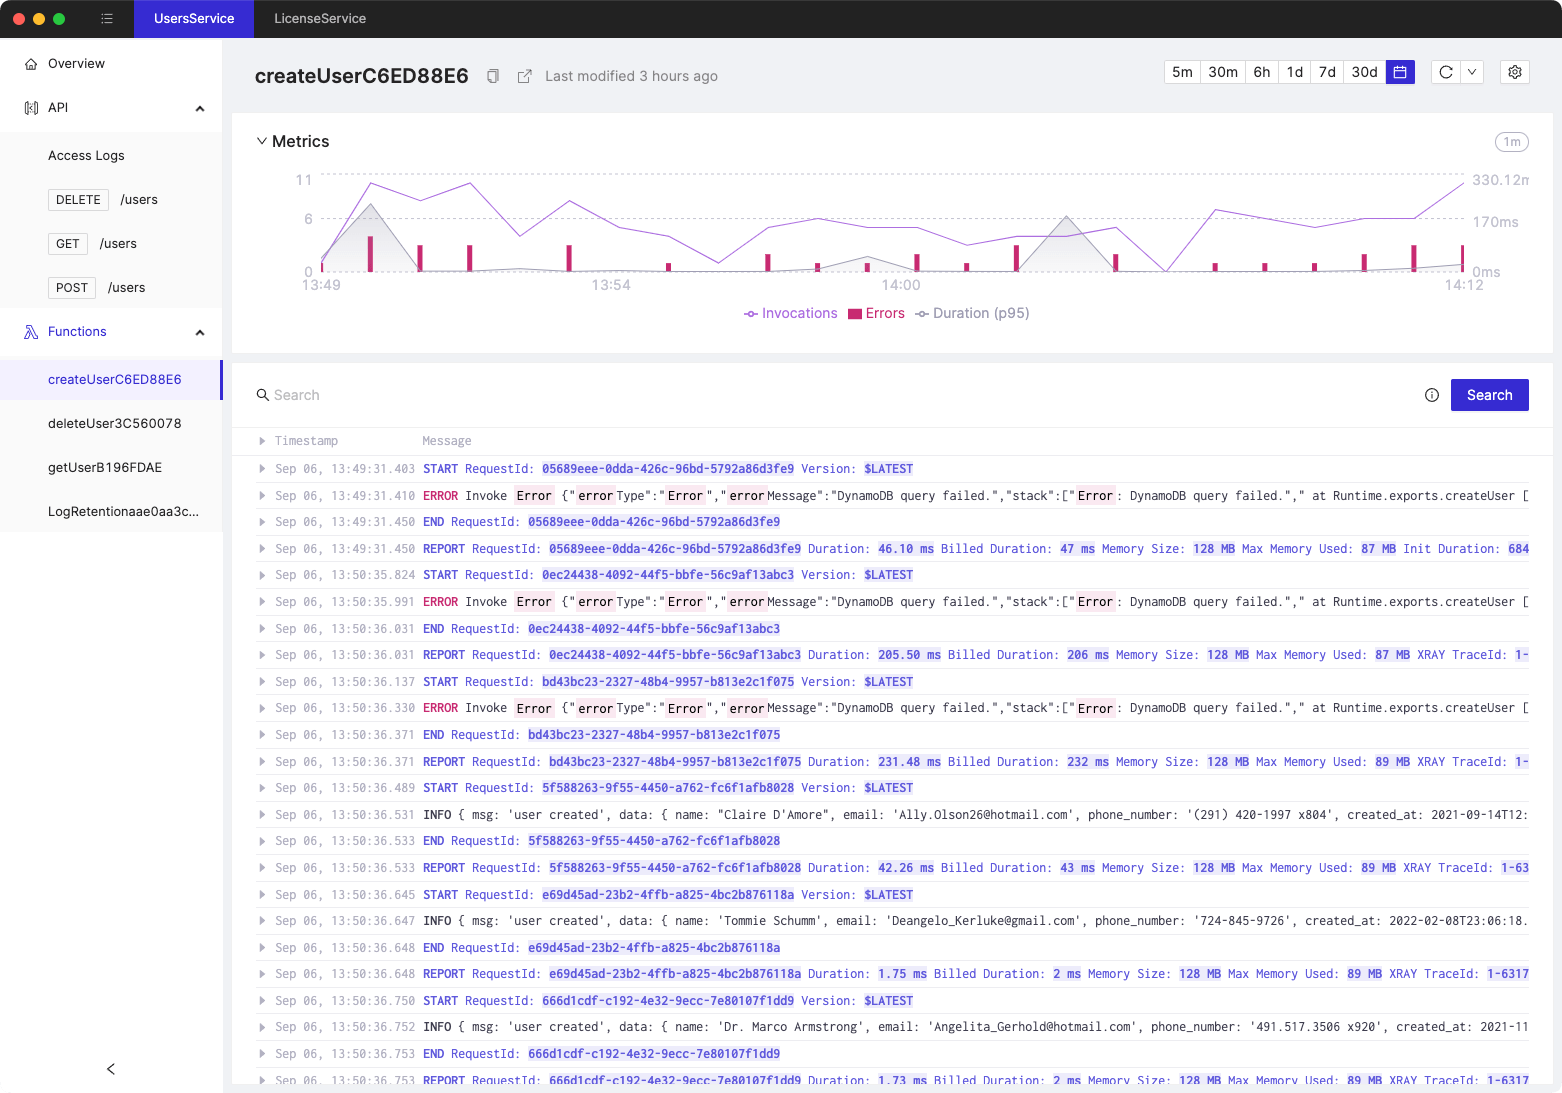
Logging SDK operations
Logging every SDK operation that you perform might be an easy way of ensuring you have a clear picture of precisely what is going on within your Lambda function. This method should be used cautiously though. Given high enough traffic, you might incur significant CloudWatch costs. In such situations, you might want to look into sampling your logs.
Luckily for us, the AWS-SDKs I'm familiar with (the Node.js and Go ones) allow for enabling such logging without us having to pollute our code with log statements everywhere. All we have to do is to pass a logger to a given SDK instance.
Here is an example of instrumenting the DocumentClient of the Node.js AWS-SDK with a logger.
import { DocumentClient } from "aws-sdk/clients/dynamodb";
import pino from "pino";

const logger = pino();

const db = new DocumentClient({
  logger: {
    /**
     * The implementation is dependant on the logger itself.
     * In a real-world scenario you most likely want to also log the `requestId` or `X-Ray traceId`.
     */
    log: (message) => {
      logger.info({}, message);
    },
  },
});
And here is the sample log message produced by adding an item to the DynamoDB table.
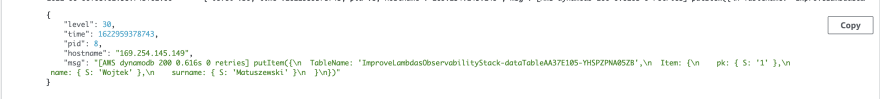
In a production setting, you most likely should redact fields that might contain sensitive information. In such a case, look into the redact configuration option of pino.
Turning on Client Side Monitoring
I've stumbled upon the Client Side Monitoring feature only recently. Enabling the CSM will cause the SDK calls to push metadata about that given call to a UDP endpoint (IP is configurable). The metadata concentrates not on the call's content but on the operation itself - what kind of API call was performed, latency, and similar information.
The following is an example event produced by the CSM.
{
  "Version": 1,
  "ClientId": "",
  "Type": "ApiCallAttempt",
  "Service": "S3",
  "Api": "ListObjectsV2",
  "Timestamp": 1590430065174,
  "AttemptLatency": 243,
  "Fqdn": "s3.amazonaws.com",
  "UserAgent": "aws-cli/1.18.51 Python/3.7.6 Darwin/19.4.0 botocore/1.16.1",
  "AccessKey": "ASIAXXXXXXXXXXXXXXXX",
  "Region": "us-east-1",
  "SessionToken": "XXX",
  "HttpStatusCode": 301,
  "XAmzRequestId": "0000000000000000",
  "XAmzId2": "XXX",
  "AwsException": "PermanentRedirect",
  "AwsExceptionMessage": "The bucket you are attempting to access must be addressed using the specified endpoint. Please send all future requests to this endpoint."
}
As you can see, the event is very different than the logs produced by the SDK calls. Why should you bother enabling CSM?
Scoping IAM policies down
Applying the principles of least privilege access in the context of Lambdas (and other compute) is crucial from the security perspective. From my perspective, the CSM is an ideal mechanism for ensuring that these principles are followed in the context of AWS-SDK calls.
You could enable CSM, run your Lambda through a couple of workloads (ideally, those would be end-to-end or integration tests), and then based on the collected metadata deduce the least privileged permissions for your function.
It turns out most of the work in that area has already been done for you. Ian Mckay released iam-live and the iam-live lambda extension. These tools make the process I described earlier a breeze. All you have to do is to hook them up to your existing stack.
Security monitoring
CSM could be used to monitor for any unusual behavior that your application might perform. While the AWS CloudTrial is a vital option in most cases, not every event lands there. Having both CSM and AWS CloudTrial in place, you gain much more visibility on the security axis than with AWS CloudTrial alone.
If you are curious how could you leverage both AWS CloudTrial and CSM so that they complement each other, checkout this great article on cloudonaut.io
Summary
These were, in my opinion, two lesser-known ways to increase observability in your AWS Lambda based AWS applications. I hope you learned something new as I did while writing this blog.
You can find me on twitter - @wm_matuszewski
Thank you for your time.
Tired of switching between AWS console tabs? 😒
Cloudash provides clear access to CloudWatch logs and metrics, to help you make quicker decisions.
Try it for free: