Guide to analyzing log data with CloudWatch Logs Insights
- Authors

- Name
- Cloudash
- @cloudashdev
CloudWatch Logs Insights is a powerful tool that allows you to search and analyze log data using queries. With Logs Insights, you can quickly identify patterns and trends in your logs, troubleshoot issues, and gain insights into the performance of your applications and systems. In this blog post, we will share some useful CloudWatch Logs Insights snippets that can help you get started with analyzing your log data.
Count occurrences of a specific string in logs
This snippet is useful for quickly identifying the number of occurrences of a specific string in your logs. You can use this query to find patterns or trends in your logs.
fields @timestamp, @message
| filter @message like /<string>/
| stats count() by bin(1m)
In this snippet, replace <string> with the string you want to search for in your logs. The query returns the number of occurrences of the string in your logs, grouped by minute.
Filter logs by time range
This snippet is useful for filtering logs by a specific time range. You can use this query to focus on logs generated during a specific period.
fields @timestamp, @message
| filter @timestamp between '<start time>' and '<end time>'
In this snippet, replace <start time> and <end time> with the start and end times of the time range you want to filter by. The query returns logs generated between the specified time range.
Calculate average duration of requests
This snippet is useful for calculating the average duration of requests in your logs. You can use this query to identify slow requests and troubleshoot performance issues.
fields @timestamp, @message
| parse @message /duration:(?<duration>\d+)/
| stats avg(duration) by bin(1m)
In this snippet, the query parses the duration value from the log message and calculates the average duration of requests, grouped by minute.
Group logs by IP address
This snippet is useful for grouping logs by IP address. You can use this query to identify patterns or trends in log data associated with a specific IP address.
fields @timestamp, @message
| parse @message /<ip_address>/
| stats count() by ip_address
In this snippet, replace <ip_address> with the IP address you want to group logs by. The query returns the number of logs associated with each IP address.
Find error messages in logs
This snippet is useful for finding error messages in your logs. You can use this query to identify issues and troubleshoot errors in your system.
fields @timestamp, @message
| filter @message like /error/
In this snippet, the query filters logs that contain the string error in the message field.
In conclusion, CloudWatch Logs Insights is a powerful tool that can help you quickly identify patterns and trends in your log data. The above snippets are just a few examples of what is possible with Logs Insights. By using these snippets and experimenting with your own queries, you can gain valuable insights into the performance of your applications and systems.
For more CloudWatch Logs Insights snippets, check out 10 CloudWatch Logs Insights examples for serverless applications.
Tired of switching between AWS console tabs? 😒
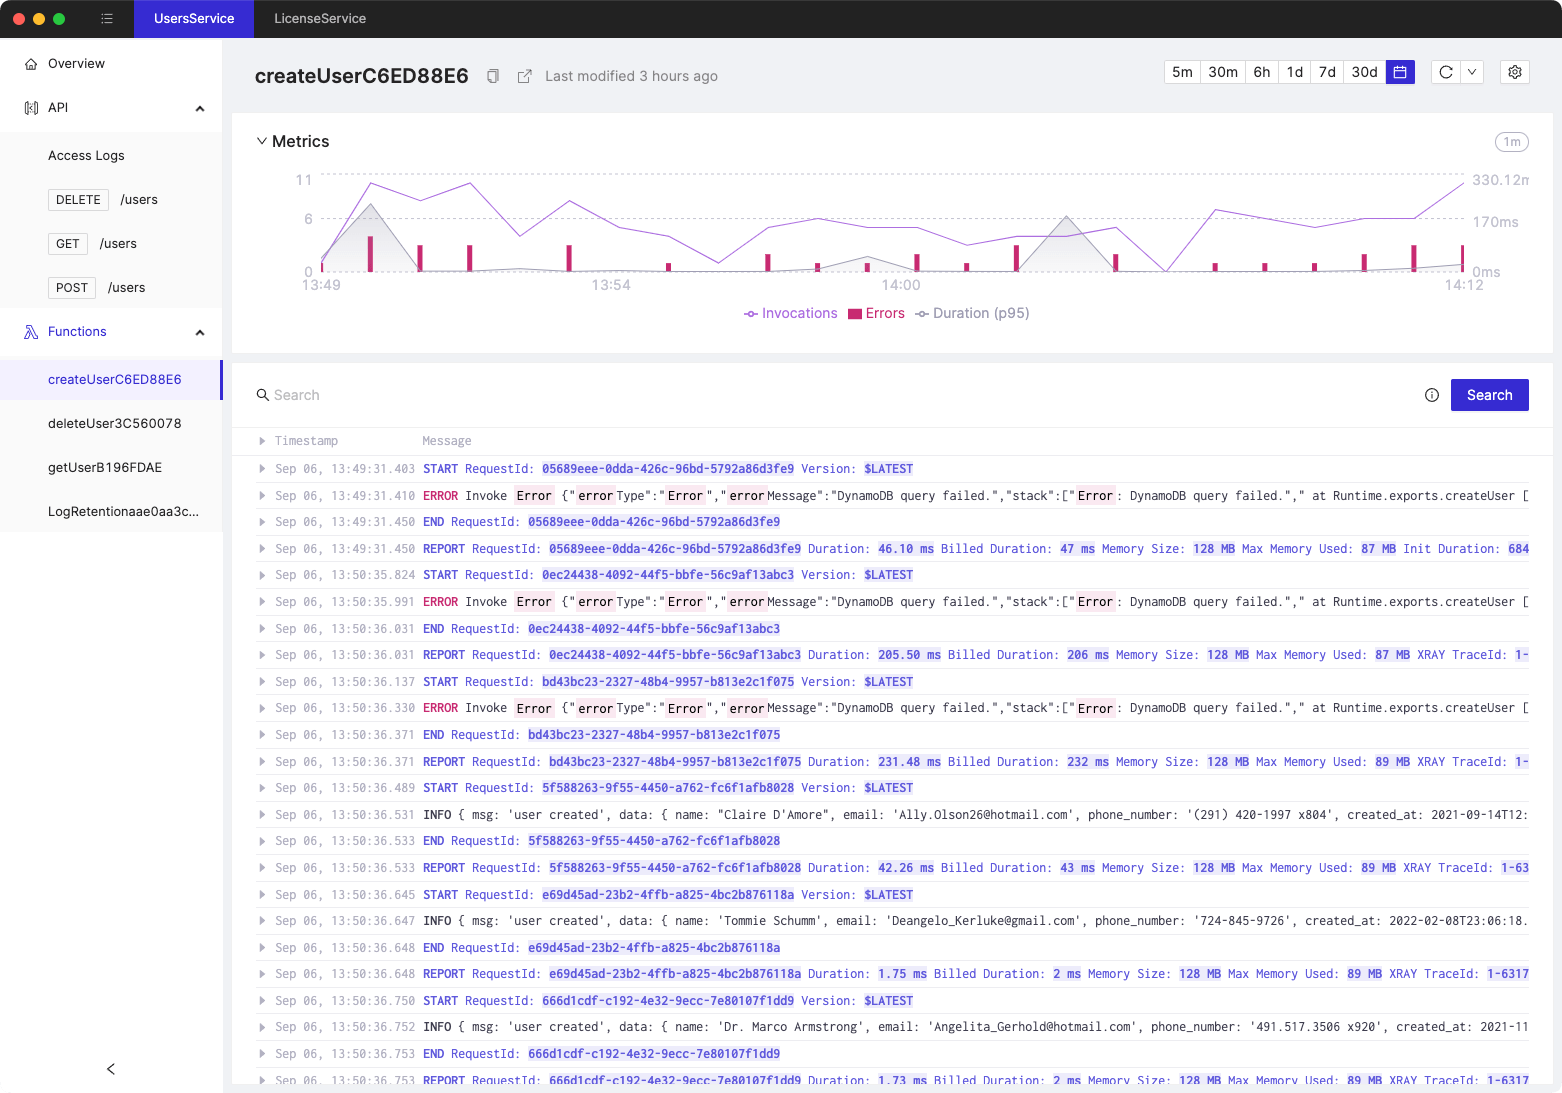
Cloudash provides clear access to CloudWatch logs and metrics, to help you make quicker decisions.
Try it for free:
