Use log levels in CloudWatch Logs to generate filter-friendly logs
- Authors

- Name
- Tomasz Łakomy
- @tlakomy
The main purpose of CloudWatch Logs is to provide a way to monitor and analyze your application logs. How do we make sure we're able to access the data we want, whenever we want?
As an example - whenever there's an error in our serverless app, we might want to filter only error-related logs to quickly find out what's going on. Luckily, CloudWatch Logs come in three different types: INFO, WARN and ERROR.
The following Node.js snippet shows how to create each of these log types:
console.log("console.log - INFO logs, useful for debugging");
console.info("console.info - INFO logs, useful for debugging (same as console.log)");
console.warn("console.warn - WARN logs, something may have gone wrong");
console.error("console.error - ERROR logs, an error occurred, something has definitely gone wrong");
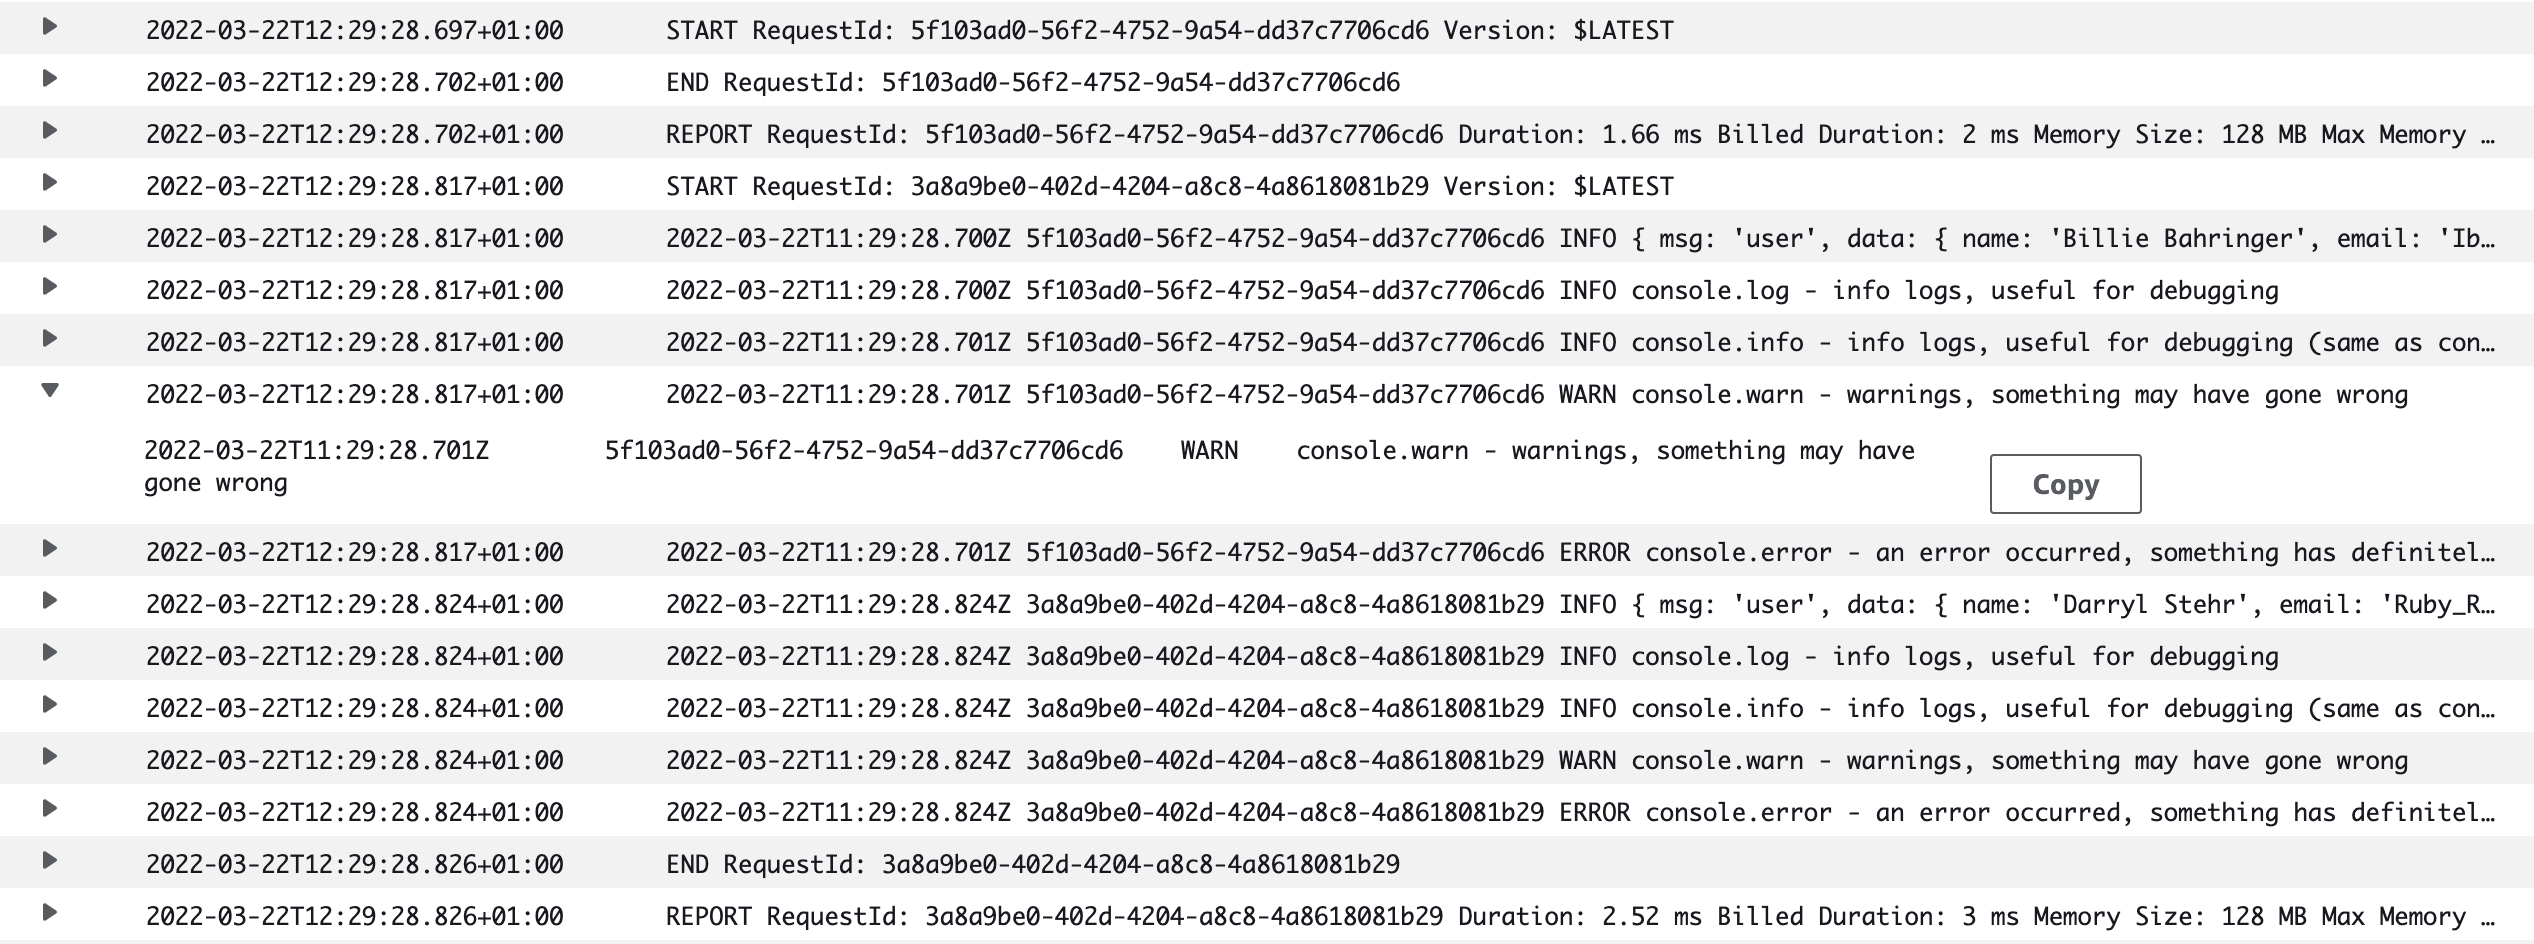
The screenshot below shows a result of each one of those console statements (note the INFO, WARN and ERROR tags):
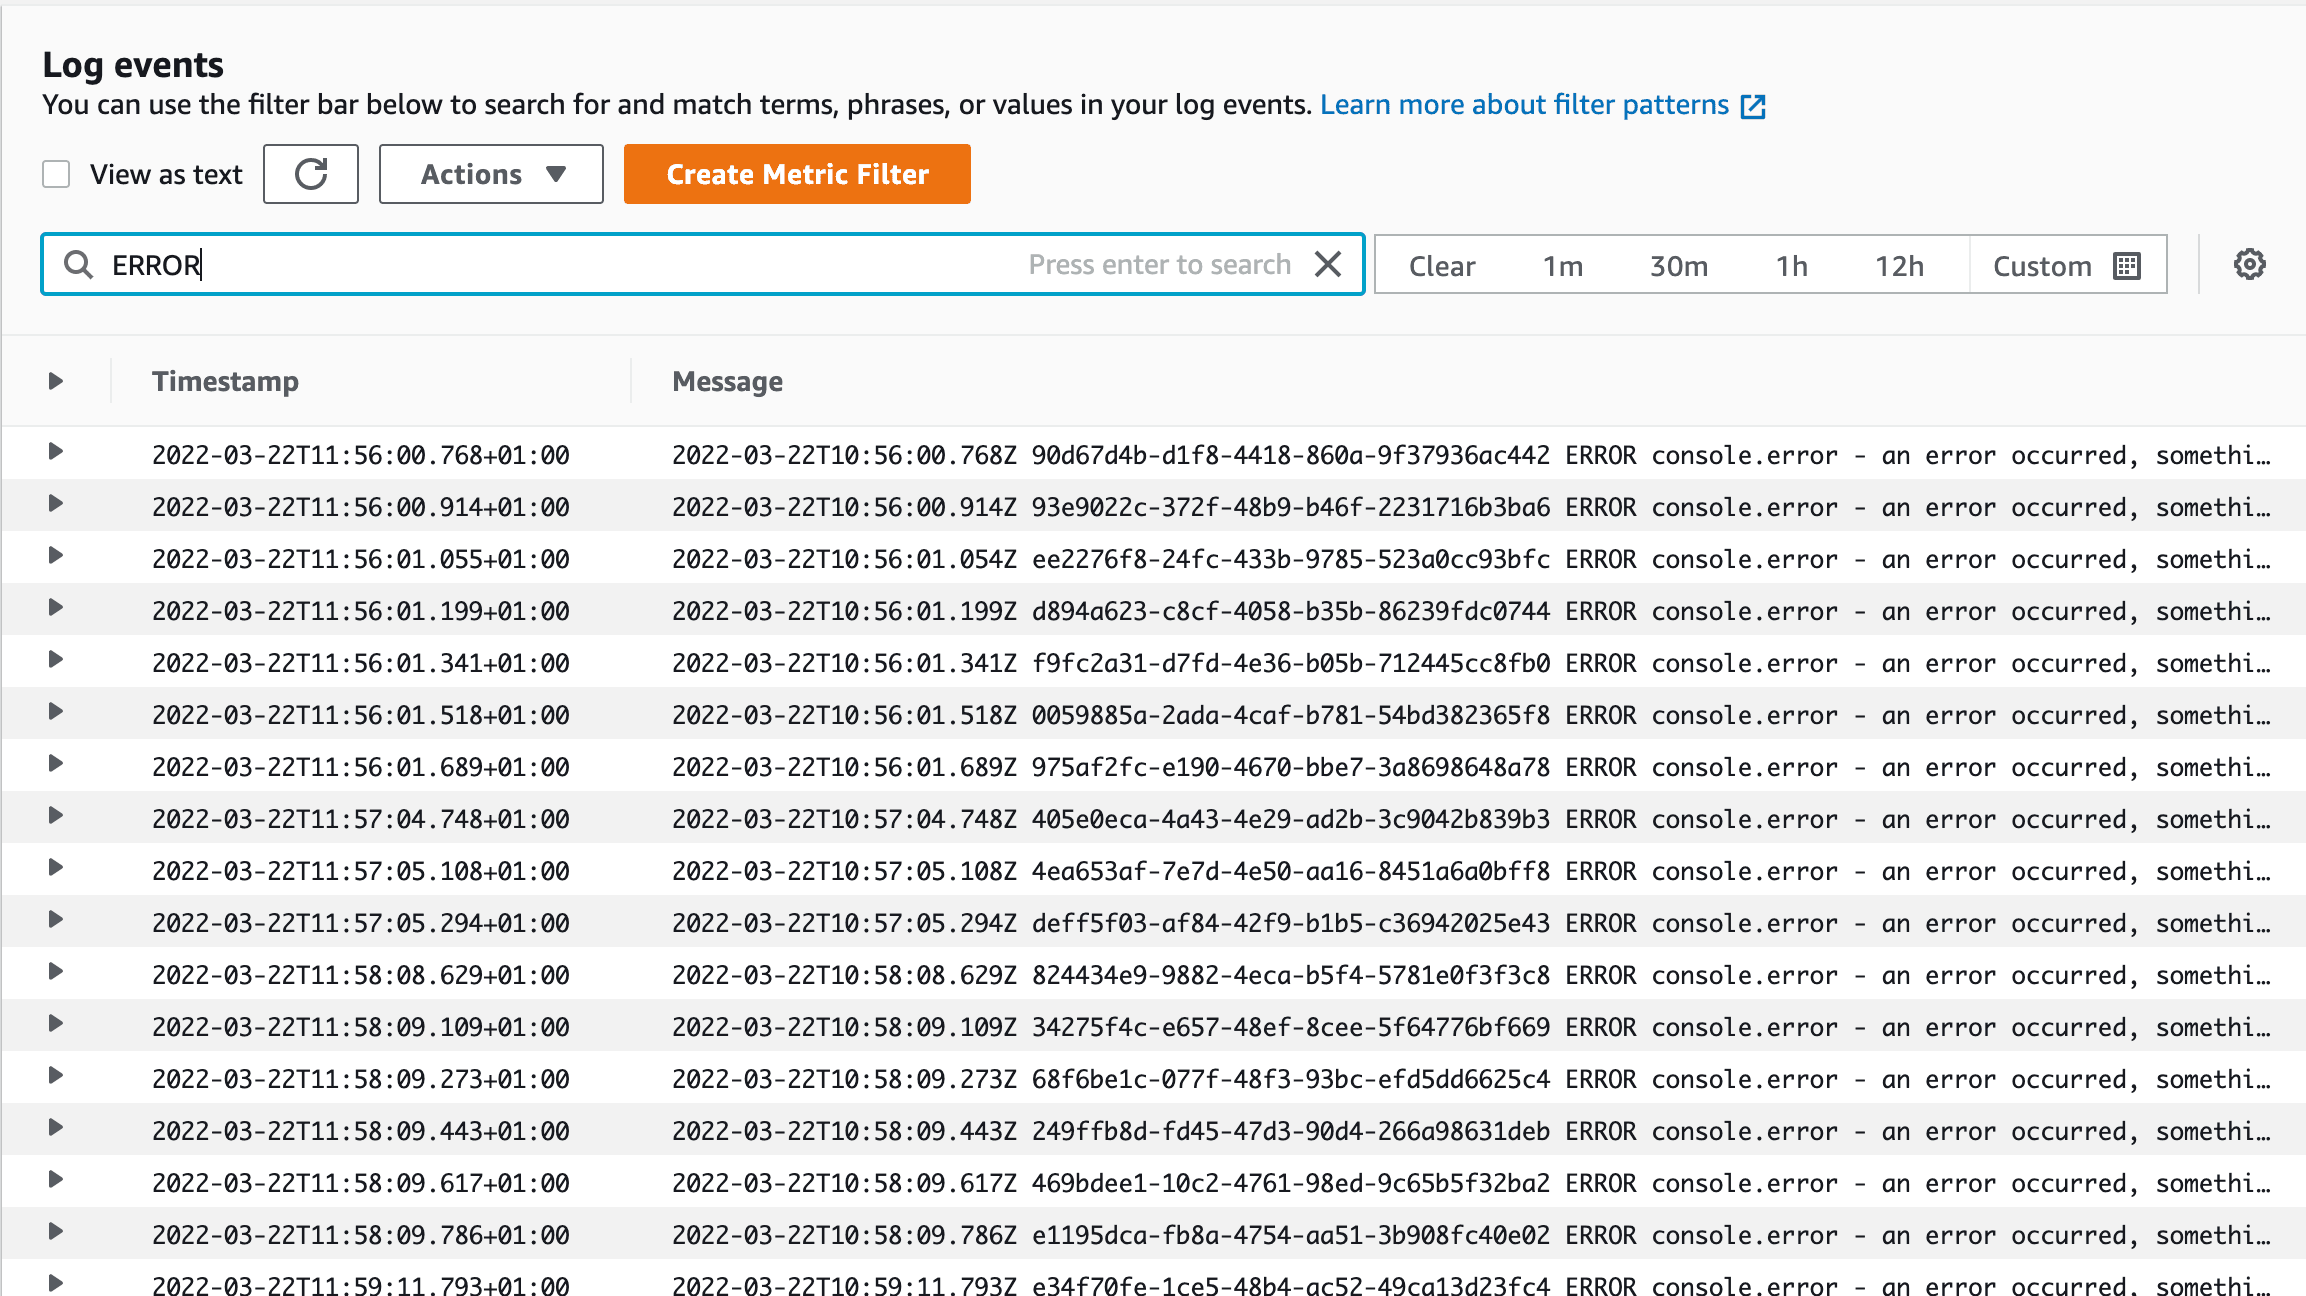
Now you can filter for all console.error logs using a CloudWatch Logs filter:
While you could add "ERROR" manually to every console.log() statement, using console.warn and console.error is a much better practice.
(We hope that this query will always return empty results in your production serverless applications)
You can also query for all ERRORs using CloudWatch Logs Insights by using a following query:
fields @timestamp, @message
| filter @message like /ERROR/
| sort @timestamp desc
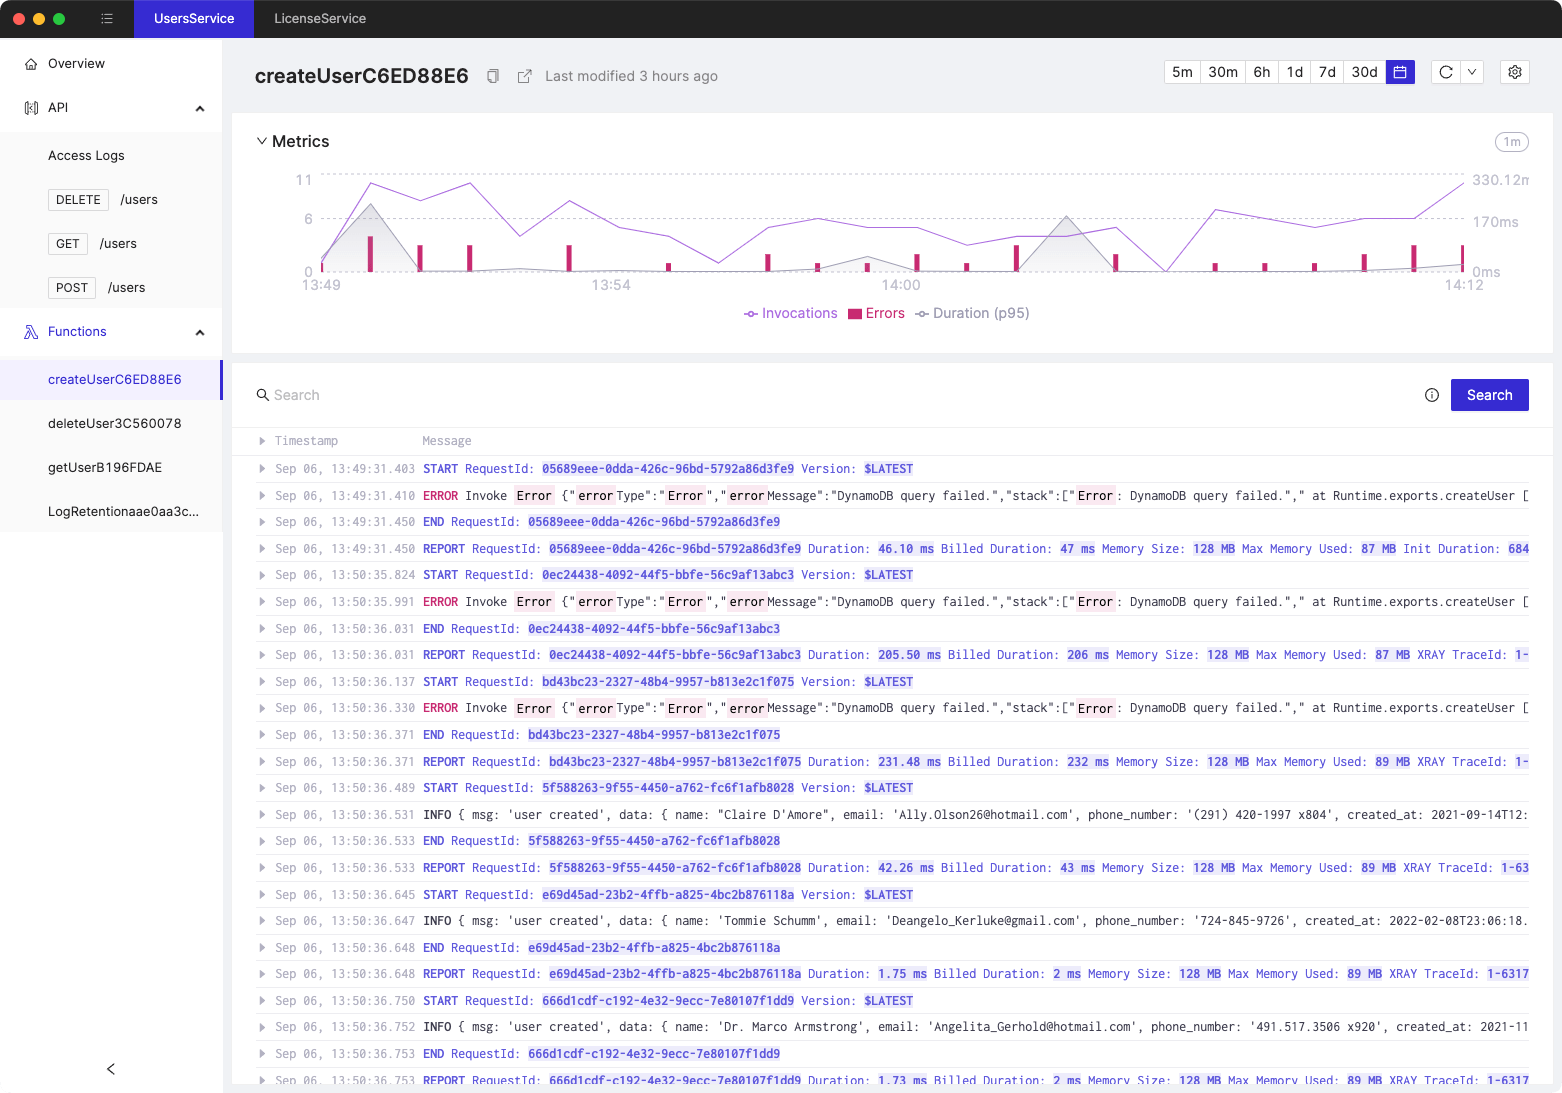
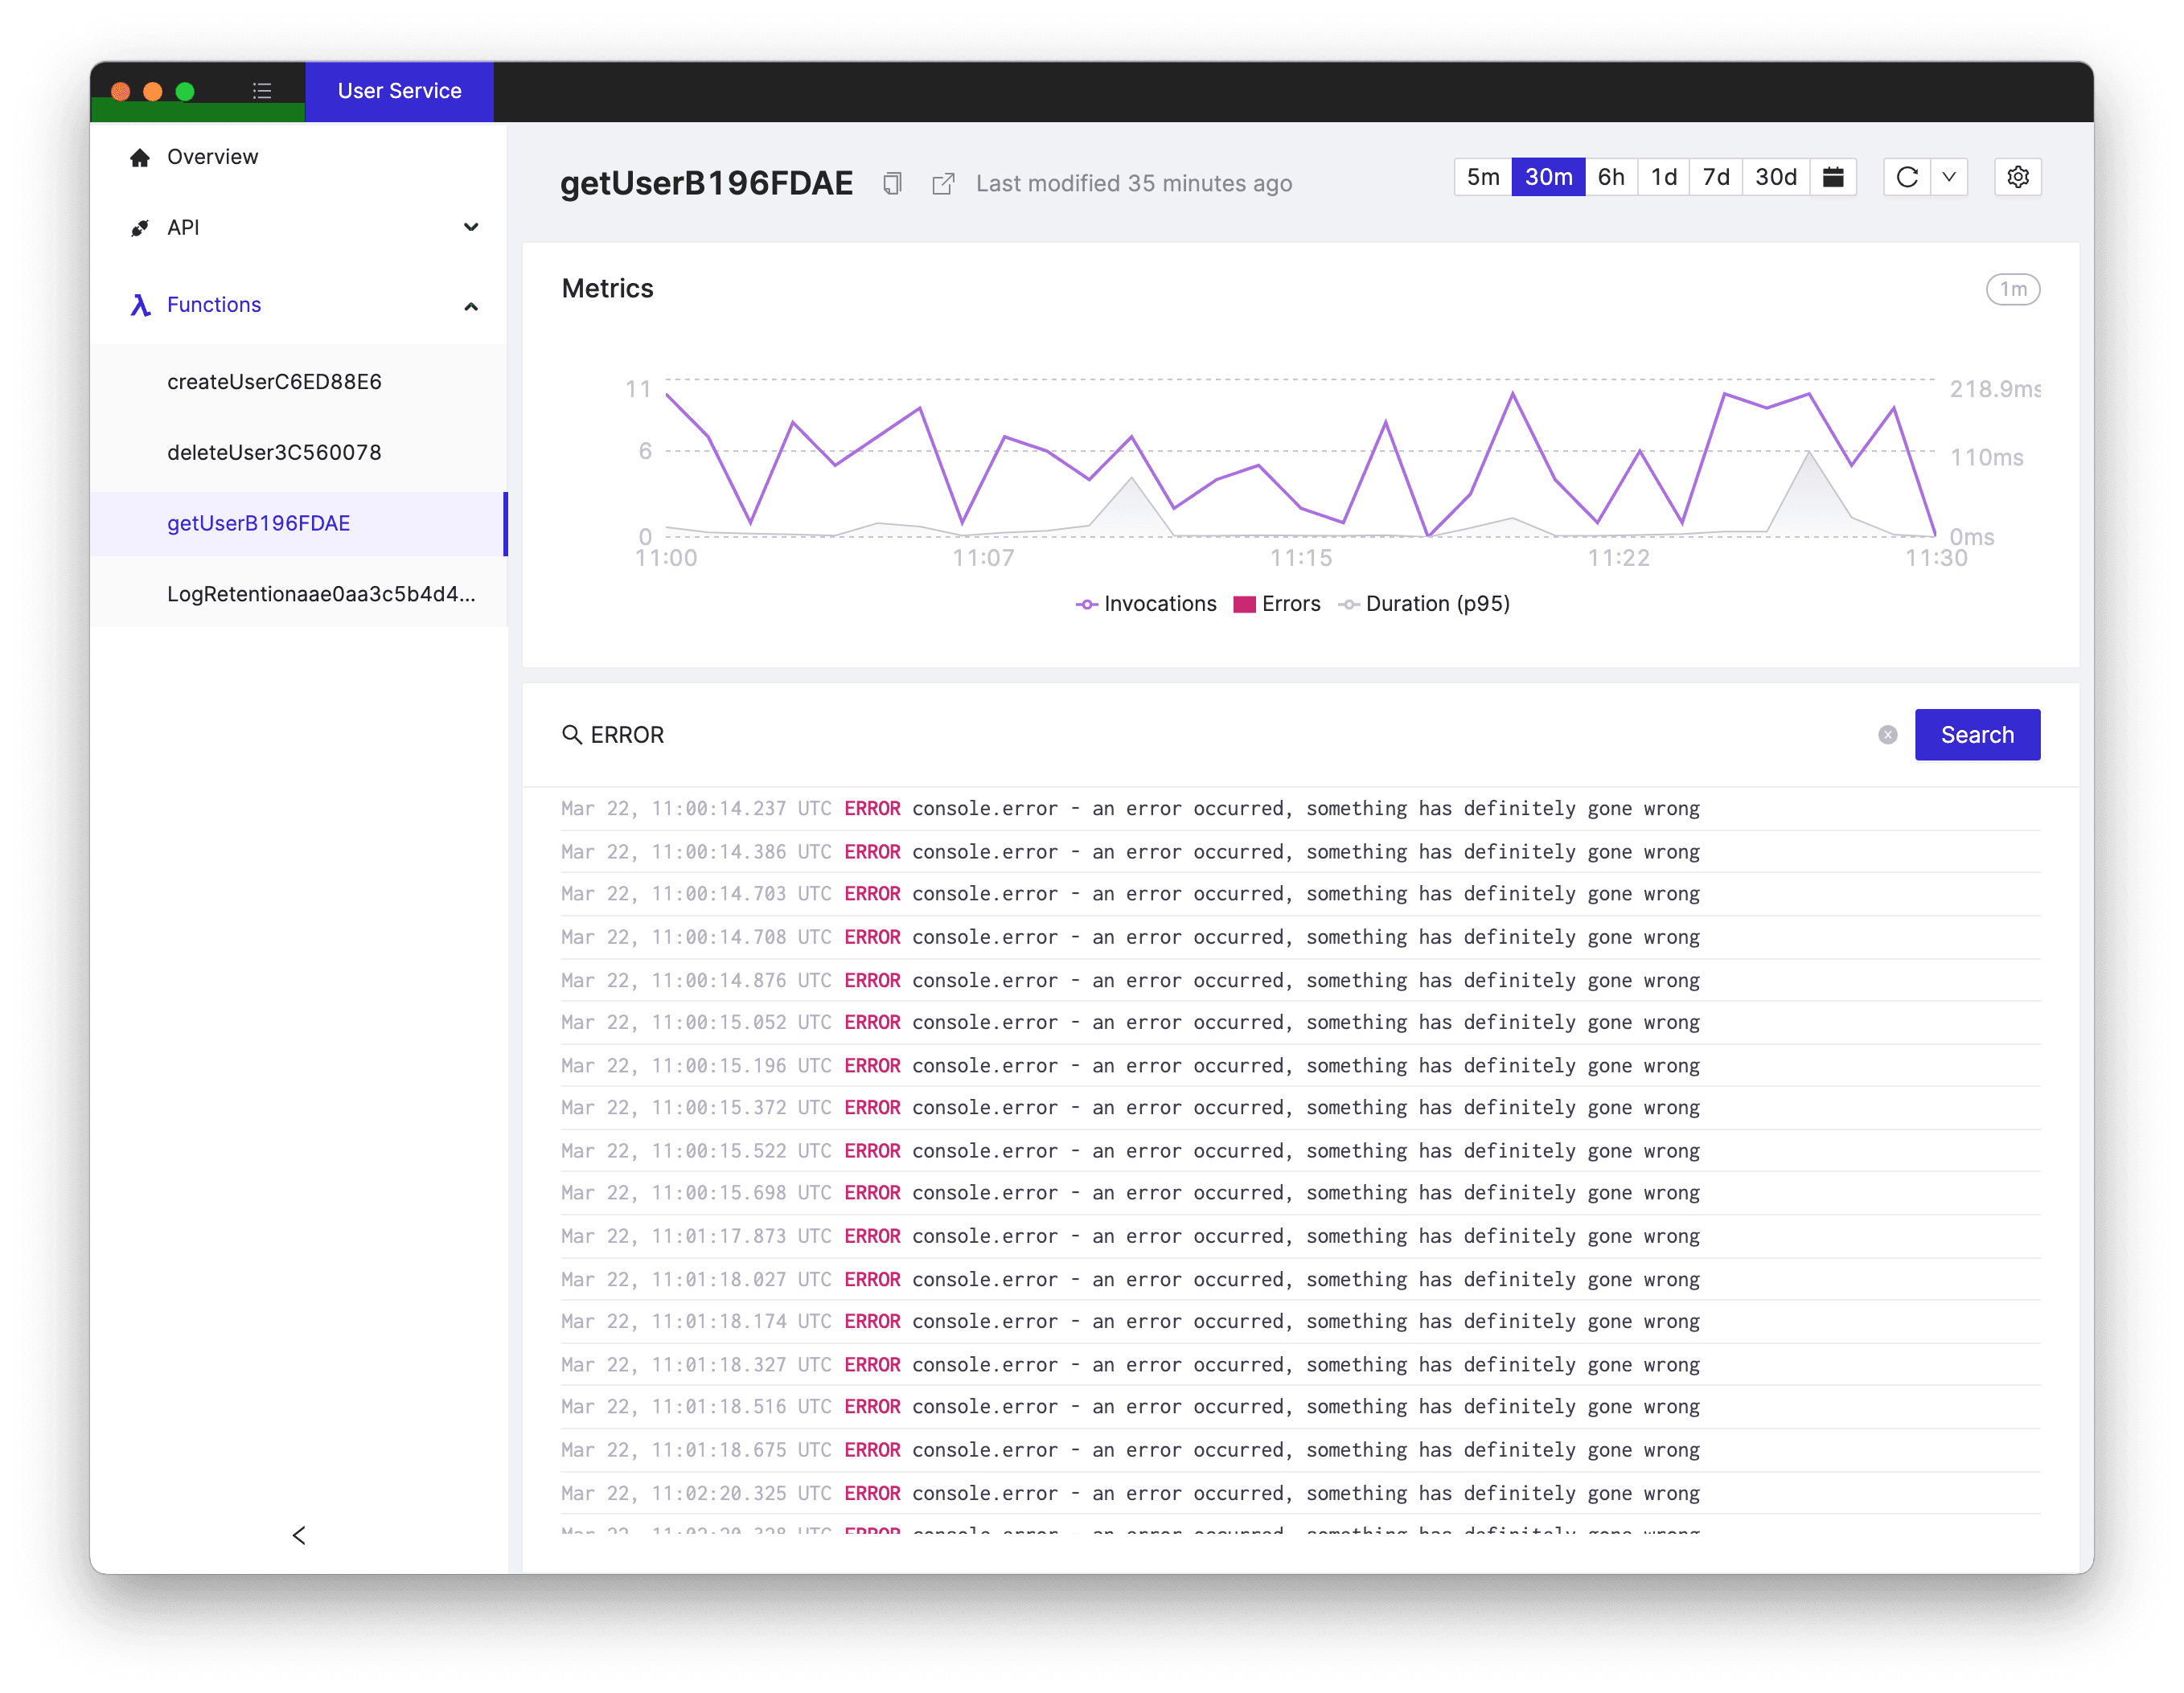
To be honest, a difference between an ERROR (which should be investigated sooner rather than later) and a regular INFO log is not that big in CloudWatch console. Whenever there's an error in our production Lambda function, we should notice that right away. Luckily Cloudash makes that easier:
Note that ERROR is highlighted and lets us know that we should dig in as soon as possible.
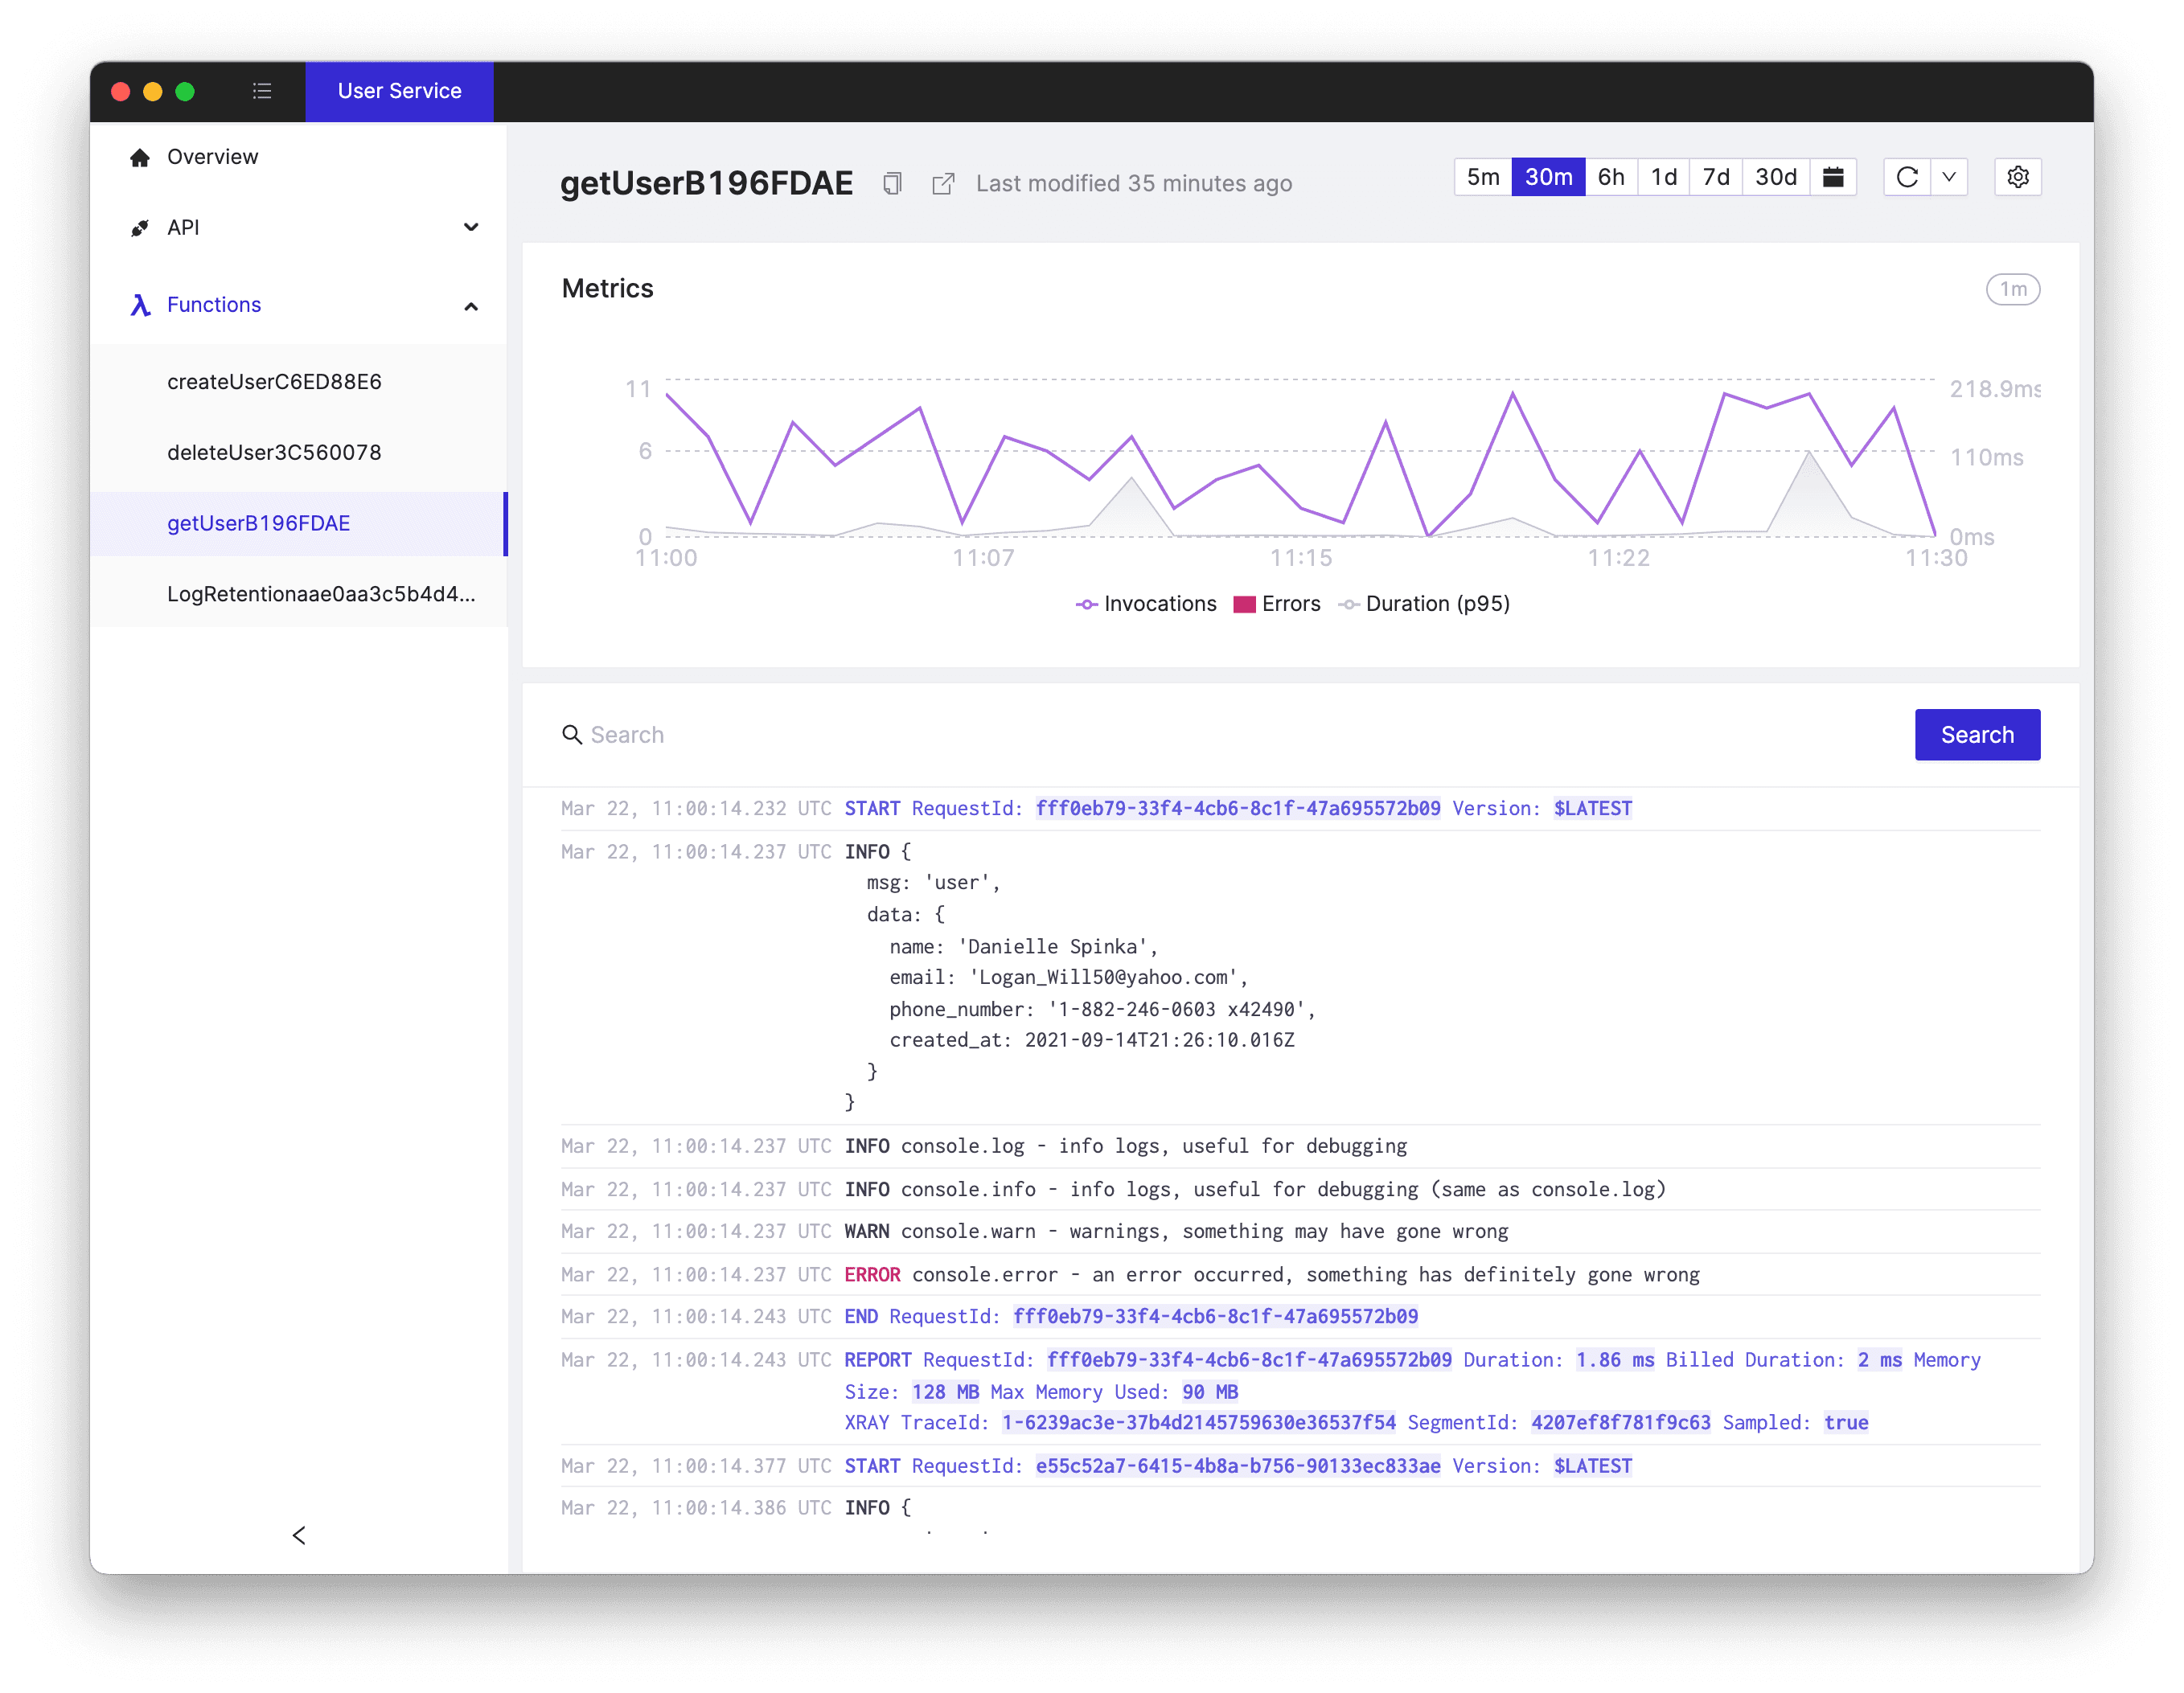
Additionally we can search for ERROR logs in Cloudash app:
Tired of switching between AWS console tabs? 😒
Cloudash provides clear access to CloudWatch logs and metrics, to help you make quicker decisions.
Try it for free: